Processing Load Report
The Processing Load report provides a very clear picture of the correlation between the load and the delays in the scheduler(s). By load we mean the number of jobs that are started, submitted, running, active and/or ended at a particular time. This report shows how the load is spread throughout the time period that you define along with the average delays during the same period. This report is a good indicator of how the scheduler is performing. Typically, this the type of system report that you will not get from any scheduler.
-
Run this report periodically, which can be once a month or once every couple of months, depending on how busy your system is.
-
Another more detailed report called Processing Load Detail with similar data to this one is also available through the CLI. For more information, see Command Line Interface.
General
Here you define the dates, times and schedulers for which you want to run the report.
-
Dates
By default, this report provides data for the last 7 days including the current day. You can change this date range or define specific dates. If you activate Include Current Day and enter 0 in Last <x> days, the report will contain data on the current day, midnight to current time.
-
Times
By default, the time range is set to 9 am to 5 pm but you can change it.
-
Schedulers
You can run this report for all schedulers in your system of for only one.
-
Sorting data
For each day in the report, you can choose how to sort the time periods.
Tip:To see which time of day has the most jobs starting, select # Job Starts and sort in descending order.
Columns
By default all columns are selected, which means that all fields will be considered in the report. You can remove the columns that you do not want to show. Also, use the up and down arrows to modify the order of the columns in the report.
Format Options
You can produce the report in multiple formats: PDF, HTML, XML and CSV. On this tab you specify the formatting options.
You can also generate the report in any specific time zone, which is particularly useful for teams that are distributed in different time zones. When you run the report, the dates will change and adapt to the selected time zone.
Example
Double click a report or select it and click the Run report in the toolbar. A message saying Run report is displayed over the AAI main tabs that lets you know that the report is still generating. When finished, the report opens in your browser.
This is what a Processing Load report could look like:
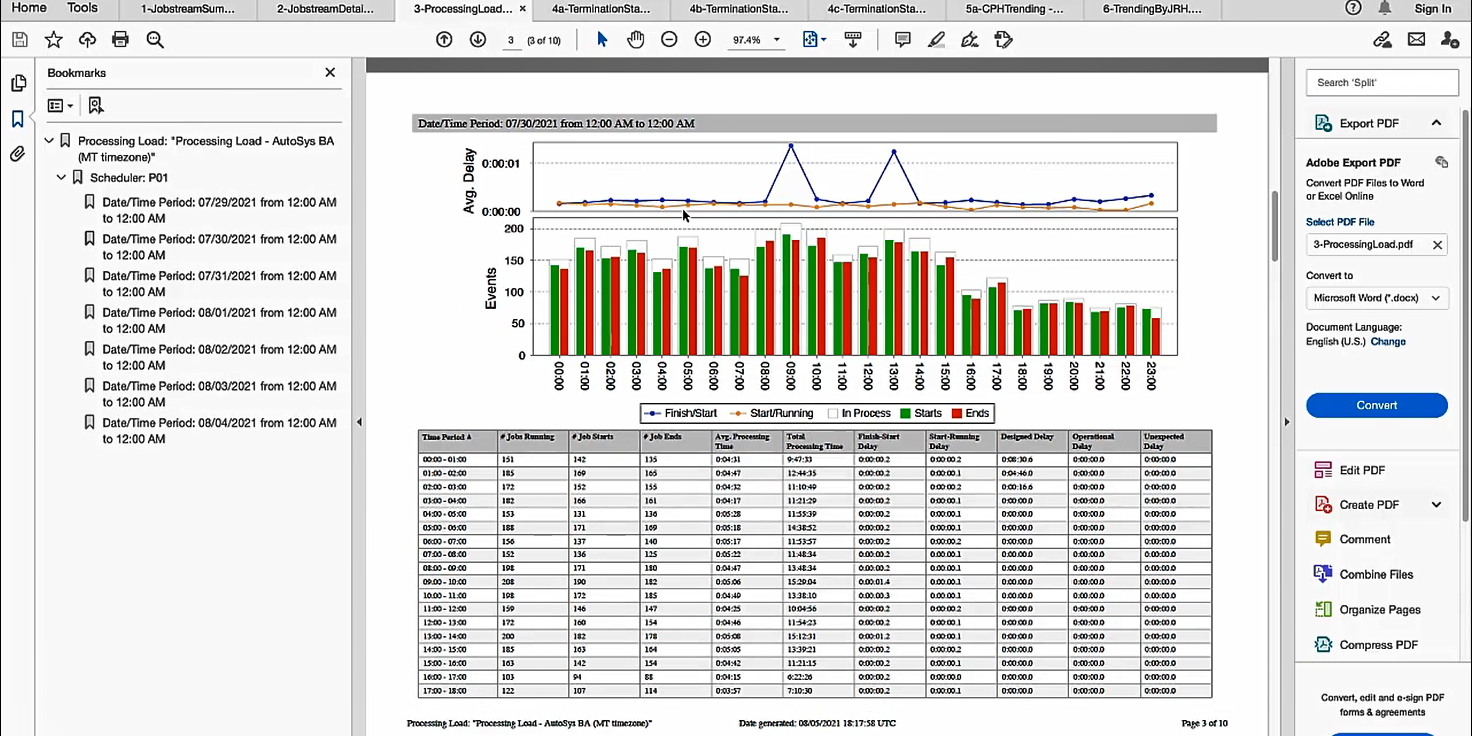
This report has two parts:
-
Graphic
The Average Delay section at the top shows the correlation between load and delay metrics. It is based on the two delays that indicate either system latency (the blue line, Finish/Start delays) or scheduler latency (the yellow line, Start/Running delays). These are system delays, which means that they are good indicators of how the scheduler is performing. For more information about the types of delays, see Types of Delays.
The Events section displays one-hour intervals for a 24-hour period. The green bars indicate how many jobs started within this interval. The red bars indicate how many jobs completed. The white bars indicate how many jobs are processing.
By combining the data on the events and on the delays you can identify potential system-based issues
-
Table
This table provides a summary of every interval that the graph displays and it includes the values of the columns configured in the report criteria.
See also: