My Catalog
My Catalog is the personal, interactive dashboard of operators and object designers. If you are an operator or object designer, you can find the description and instructions to work with your catalog in this topic. If you are an administrator, see Configuring the User Catalog for information and instructions on how to configure it.
My Catalog is available as Process Automation widget from the Dashboard. See Process Automation Widgets.
Take a look at Example: Configuring the User Catalog for an example of how to set up the My Catalog.
This page includes the following:
Purpose of My Catalog
My Catalog gives you direct access to the folders and objects that you are entitled to work with. Depending on your authorizations, My Catalog lets you perform the following functions:
- Open an object in read-only mode and see its details, including the estimated runtime (if available)
- Execute objects
- Open the task monitor and, if necessary, react immediately
- Modify the task properties at runtime, provided you have the necessary rights
- Open the last report created for the task
- Access the execution data of an object
Description of My Catalog
The My Catalog perspective is divided in three areas:
-
Navigation pane on the left. It contains two tabs:
-
Catalog tab
Your system administrator has granted you rights and authorizations to objects and folders by including you in User Groups. To make those objects and folders visible in your Catalog, the administrator has arranged them in the User Catalog list in the Process Assembly perspective.
The Catalog tab contains all those folders and objects.
For information about how My Catalog is configured, see Configuring the User Catalog.
-
Favorites tab
Collect the objects you need on a daily basis in this tab. On the Catalog tab, right-click the object and select Add to Favorites. A dialog prompts you to confirm your action.
The objects in these tabs provide the following information:
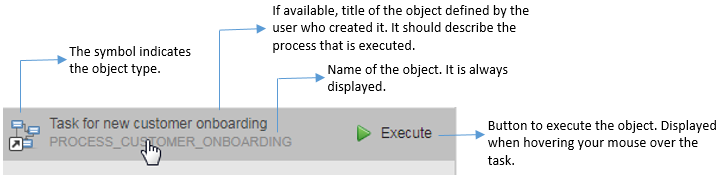
-
-
Content pane at the center. It contains the following panes:
-
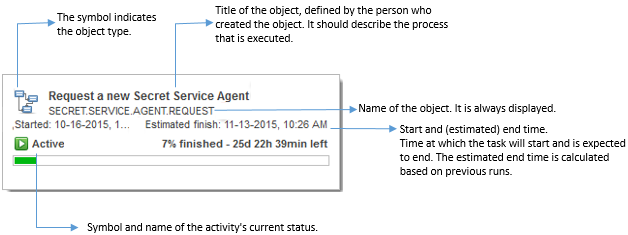
Activities pane
This pane displays the active executions of the objects that you have started. Each activity in the list includes the following details:
Ended activities are only listed if they have not yet been deactivated. Deactivating ended activities removes them from the list. Depending on the object's configuration settings, this happens either automatically or you can do it manually in the Process Monitoring perspective.
Tip: Use the SHOW dropdown list to restrict the objects displayed on the pane to those that match the selected status:
-
History pane
By default, the history of the last 50 days is displayed. The content of the list is limited to a maximum of 100 entries.
This pane provides the following details on the runs:
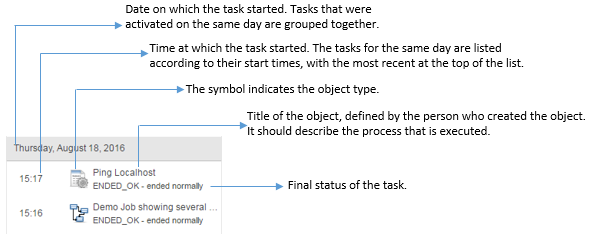
-
-
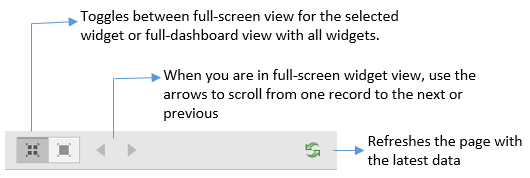
Toolbar at the top to help you navigate through full screened objects and refresh the view
Executing a Task
This option is available for executable objects. If the object configuration requires you to enter values before executing it, the Request dialog opens up. Enter the necessary data and click Submit.
You execute them either from the navigation pane, both from the Favorites and from the Catalog tab, or from the Activities pane.
To Execute an Object or a Task
- On the Catalog or Favorites tab on the navigation pane hover your mouse over the task to display the Execute button and click it.
-
The object or task is started.
A dialog box opens at the top of the window indicating it. If available, it also provides a link to the task monitor. This allows you not only to check the progress of the execution but also to further process it, provided you have the necessary rights.
For more information, see Requests.
Opening the Object in Read-Only Mode
To better understand why the objects behave as they do, you can open the object definition in read-only mode and check its settings. This is particularly useful if a task fails and the information on the Executions list is not enough to understand what went wrong.
On the navigation pane on the left hand side right-click the object and select Open.
For more information see Defining Objects.
Adding to and Removing Objects from the Favorites Tab
Right-click the object and, depending on the tab on which you are currently working, select Add to Favorites or Remove from Favorites.
Opening the List of Executions of a Task
The Executions list provides historical details on a particular task and allows you to further process it, provided you have the necessary rights.
To Open the List of Executions
-
Do one of the following:
- On the Catalog or Favorites tab on the navigation pane right-click the object and select Executions.
- Right-click an item on the Activities pane and select Executions.
-
In the Executions list each row is an execution of the selected task. By default, the last one is displayed at the top
-
If you want to further process an activity (cancel, suspend, restart, etc.), right-click on it to open a context menu with all the available functions.
Which functions are displayed depends on your rights and on the status of the selected activity.
For more information, see:
Opening the Last Report
Combined with the information provided by the Executions list, the reports provide comprehensive information on the actions carried out on an object. They are created for all executable objects.
To Access the Reports of an Executable Object
- On the Catalog or Favorites tab on the navigation pane right-click the object and select Open Last Report.
- The Report window is displayed. For details on how to work with it see Working with the Reports Window.
For more information, see:
- Reports
- Reports for Executable Objects
- Live Preview of Job Reports (REP)
- External (Directory) Reports
Opening the Task Monitor
The Process Monitoring perspective provides all the tools you need to monitor, further process (cancel, suspend, restart, etc) or modify tasks at runtime if you see that something is going wrong.
Whether you can process the task or modify it in the Monitor depends on the status of the task and on your rights.
To Open the Task Monitor
- On the Activities pane right-click the workflow or schedule object and select Open Monitor.
- The monitor window for the selected object is displayed.
For more information, see:
- Monitoring Workflows
- Monitoring Schedules
- Monitoring Jobs
- Monitoring Job Groups
- Monitoring Events
- Monitoring Agent Groups
- Monitoring Sync Objects
See also: