Working with Dashboard Widgets (Web UI)
Widgets are the building blocks of your dashboard. You can add widgets of any kind on your dashboard and once there, you can manipulate the column configuration and trigger PDF or CSV downloads. You can re-size and move widgets on a dashboard to get an optimal view into the data that is relevant to you. And, if the widget view is not adequate for a more thorough investigation of the related data, you can open the full data insight and continue to work with it and all the functions available to you.
This topic covers what you see on a widget and describes what you can do on a widget and actions you can take from one.
This page includes the following:
Understanding the Structure of a Widget
Every widget has both identifying information and data, as well as tools to work with the widget. The areas for these are marked in the following widget example:
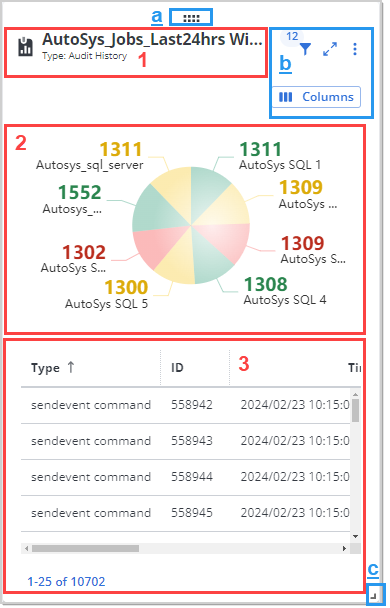
Each widget has the following three areas of information and data that are drawn from its source data insight:
-
The header contains the following:
-
The name of the widget, which is the name of the source data insight that the widget is a view into. You cannot change the widget name. If the data insight name is changed, the name of the widget changes, too.
-
The data insight type. You cannot change this.
-
-
The graphic
This is the same graphic as it is in the source data insight.
You can quick filter the table data by clicking segments on the graph to pop them out. The value of the segment is added to the filters that are defined for the data insight. You can select more than one segment to see the related data rows in the table. Each selected segment pops out. Click a segment that is popped out to pop it back into the whole graphic and remove that value from the filters on the table. When all segments are popped into the whole, you see the data as it is filtered in the data insight definition.
-
The table
The table shows all the data rows that match the filters defined in the source data insight, and can be further filtered when you apply quick filters on the graphic. The total at the bottom of the table shows you how many rows match the all the filter criteria.
You can configure the columns in the following ways:
-
Rearrange the columns by dragging and dropping them to a new position.
-
Use the Columns menu in the toolbox to show or hide columns.
You can also sort the rows based values in the various columns. You can even sort by more than one column in a hierarchy of sort values. For information, see Working with Tables.
Since the widget is generally smaller than a full-page data insight, use not only the vertical scroll bar to scroll through the rows, but also the horizontal scroll bar to scroll through the columns. You see only the first 25 rows of data. To see all data rows, you have to open the source data insight by clicking the text 1-25 of ####### rows or clicking the Open Source Data Insight icon
 in the toolbox. For information, see Using a Data Insight.
 -
In addition, each widget has three areas that you find tools to further understand the data on the widget, to manipulate what you see, and to arrange the widget on the tab page. You find these tools in the following:
-
The grab bar

Use this when you have more than one widget on the tab page to move the widget to another place on the tab page. Click the grab bar icon
and then drag and drop the widget in a new location. The other widgets are rearranged automatically, filling the page from left to right and top to bottom, without any gaps that could be filled. -
The toolbox in the upper right corner of the widget contains the following tools:
-
Filter information: Mouse over the filter icon to open a frame with a list of the filters defined in the source data insight and, therefore, applied to this widget. The bubble on the filter icon shows the number of filters that are defined.
Every data insight has at least one filter defined for the data range.
-
Open Source Data Insight button
: Click this button to open the source data insight, where you can see the data on a full page and work with the filters as well as column configurations. If you are the owner or an editor of the data insight, you can also save those changes as part of the definition. For information, see Using a Data Insight. To return to the dashboard tab page from there, click the back button on your web browser.
-
The Columns menu: Click this to open a list of columns available to see in the table and select which you want to show or hide. Columns with key data must always show.
-
The Actions menu: Click the actions button
 (a vertical ellipsis) in the upper right corner to open the actions menu that offers several actions that you can take. For information, see Taking Actions on a Widget.
-
-
The sizing tool in the lower right corner of the widget.
To expand or collapse the size of the widget, click the sizing tool then drag the corner out or into the widget to increase or decrease its size on the dashboard tab.
You can drag the widget width to file one third, two thirds, or the full width of the tab page, and you can make the widget as long as you want. Any other widgets are automatically moved accordingly.
Dynamically Changing the Configuration of a Widget
While viewing the widgets your dashboard tab pages, you can change some configurations for the presentation of the data on the widget. When you leave the dashboards to another part of AAI or when you log out, those changed configurations are saved for you. This allows you to personalize the widgets to best serve your needs without altering the source data insight. You can also put more than one copy of the same widget on your dashboard, and although they are based on the same data insight, you can configure each one differently so that you get to views on the same original data set. For example, you can quick filter one widget to show the data for one scheduler and quick filter another widget to show the data for another scheduler. By placing them side by side, you can keep an eye on both schedulers at once.
The things that you can change on a widget are the following:
-
The column selection (show/hide)
-
The column arrangement
-
The sort order and hierarchy
-
The quick filter selection
For more information, see Working with Tables and Using a Data Insight.
The things that you cannot change are the following:
-
The filters that are defined in the source data insight.
You can see which filters are set by clicking the filter icon in the toolbox of the widget.
-
The name of the widget.
This comes from the data insight name. If you copy a widget to the same dashboard tab page, the name of the copy is Copy of [Original Widget Name].
-
The type of the source data insight. No one can change this.
-
The number of rows that you can view.
The maximum number of rows that you can view in a widget is 25 rows. You can drag the bottom border of the widget to expand it vertically to show all 25 rows.
If you are the owner or an editor of the source data insight, you can change the name and the filters by editing the source. You can do this either from the Data Insights section or by clicking the Open Source Data Insight button![]() . These changes then go into effect for everyone who has access the data insight and on all widgets based on that data insight. For more information, see Using a Data Insight.
. These changes then go into effect for everyone who has access the data insight and on all widgets based on that data insight. For more information, see Using a Data Insight.
Taking Actions on a Widget
Every widget has an Actions menu that is similar to the Actions menu of the source data insight, but with only relevant options for widgets. To take one of these actions on a widget, use the following steps:
-
Click the Actions menu button
in the upper right corner of the widget. -
Select the action you want to take.
-
Edit Data Insight (available only for the owner or editors of a data insight): Opens the Edit Data Insight dialog for the source data insight, allowing you to edit any or all aspects of the source data insight.
If you edit anything that affects what is visible and included in the data insight (its Name or the Filters or Column settings), those changes will show up on any widgets based on the data insight. The Printing options set for PDF output will also affect how PDFs are printed from a related widget. For information, see Adding, Editing, Copying, and Deleting Data Insights and Report Settings for Data Insights.
-
Save a Copy: Create a copy of the widget with the currently set column configurations and sort orders in addition to the filter and the Group By setting from the source data insight. For information, see Using a Data Insight.
The Copy [Data Insight/Widget name] dialog opens.
-
Select the Dashboard Tab and the Initial Size for the widget. For more information, see Adding a Widget to Your Dashboard (Web UI).
-
Click Copy to Selected Tab.
When you copy to the same tab page, then a second widget is added with the name Copy of [Original Widget Name]. When you copy to a different tab page, the widget that is added retains its original name. You cannot edit widget names.
Tip:Although you cannot move a widget directly from one tab page to another on your dashboard, you can copy the widget to another dashboard. Then, if you want, you can delete the widget you copied on the original tab page.
-
-
Delete: Remove the data insight from the current dashboard tab. It remains on any other tab pages and the source data insight is not affected.
-
Download (CSV): Create and download a CSV file with the data as it is filtered and configured in the data table at the moment when the file is created. For more information, see Actions for Downloading, Printing, and Emailing Data Insights.
-
Print (PDF): Create and download a PDF file that contains the graph and the data table with the data as it is filtered and configured at the moment when the file is created. For more information, see Actions for Downloading, Printing, and Emailing Data Insights.
-