Using a Data Insight
When you open a data insight, you see the data that is extracted from the AAI database according to the filters and data columns specified in its definition. The data is presented both in a summarizing graphic and in a detailed table. This topic describes what you find when viewing any data insight and how you can modify the data and its presentation in real time, while viewing the data insight. Furthermore, this topic covers the actions that you can take on a data insight, which includes triggering output to capture snapshots of the data, adding one to your dashboard, or sharing it with others, and more.
This topic covers what is common to all data insights. For specific information about the individual data insight types, see the related topics.
This page includes the following:
Opening and Closing a Data Insight
There are two ways to open a data insight to view and manipulate the data:
-
Starting on any tab view of the Data Insights list, find the row for the data insight and click the Name.
-
Starting from a dashboard tab that contains a widget based on the data insight, click the Open data insight double arrow in the upper right of the widget.
There are two ways to close a data insight, depending on where you began:
-
If you opened the data insight from the Data Insights list, click the back button on your web browser. You return to the list of data insights.
-
If you opened the data insight view from a dashboard widget, you can do one of the following:
-
Click the Return to dashboard double arrow in the upper right of the title bar of the data insight. You return to the dashboard tab page where you began with the widget in its normal size.
-
Click the back button on your web browser. You return to the dashboard tab that you started from.
-
The Data Insight Page
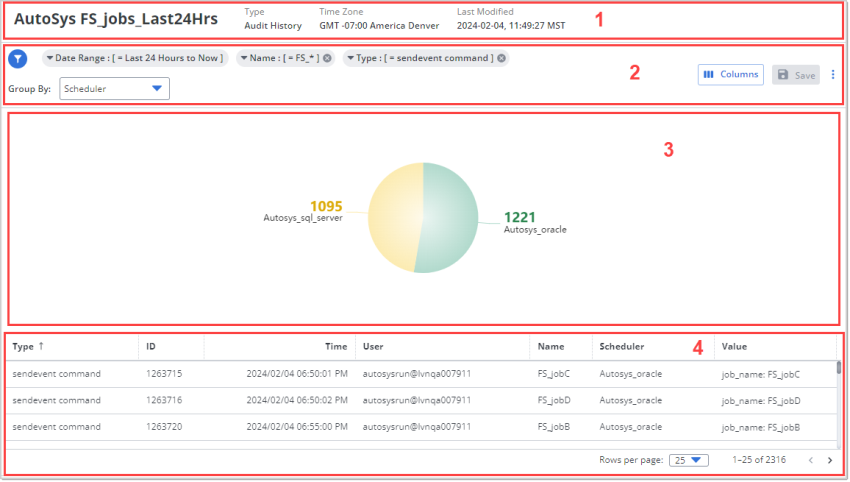
Regardless of which type of data insight that you open, the page that displays the data insight has the same general layout with the same kinds of information in each part of the page. As an example, here is the data insight page for an Audit History data insight.
The following are the common parts of any data insight page that you view:
-
The title bar contains the following basic information about the data insight (from left to right):
-
The name of the data insight in large bold print.
-
The Type of data insight it is.
-
The Time Zone of the date and times on the data table and also used in filters and calculations for the data.
-
The Last Modified date and time when the data insight definition was last updated in any way.
-
-
The toolbar contains tools for modifying the data and how it is presented, as well as tools for taking actions on the data insight. Depending on the data insight type the toolbar can contain some, or all of the following:
-
Filter options

These appear in the top row of the toolbar. Any currently applied filters appear next to the filter icon. At a minimum, a date specification or date range filter must be applied. You can modify the filters while viewing the data insight, and click Reset to undo all changes and return to the filters in the data insight's definition.
-
The Group By option:
This allows you to select the column with the values that you want to have aggregated for the graphic segmentation. For more information, see Using Data Insight Graphics.
-
Three view toggle buttons:
These allow you to switch among the standard view with both a graphic and a data table, a view with only the graphic, and a view with only the table. These buttons are always available.
-
The Columns button, to open the list of available columns that you can include in the data table. For more information, see Using Data Insight Tables. This is always available.
-
The Save button to save changes that you, as the owner or an editor, make to the filters, grouping, or column configuration on the data insight definition. If you have only view rights to the data insight, this button is never activated. Active or not, this is always available.
-
The Actions button
 to open the Actions menu that lists the available actions that you can take on the data insight. For more information, see Taking Actions on the Data Insight. This is always available.
-
-
The graphic below the toolbar, shows a chart or graphic that visualizes the data. Depending on the data insight type, this can be a line graph, a pie chart, or other kind of graphic that best captures the data in a meaningful and helpful way. If there is a Group By option, it determines what is aggregated for the data points on the graphic. All graphics are interactive allowing you to drill down into the data and, because the graphic and the data table are kept in sync, drilling down or panning up on the graph acts as a quick filter of the data on the table. For more information, see Using Data Insight Graphics.
-
The data table below the graphic contains all the filtered data. The data is presented according to how the columns are configured and sorted. The table also shows you which data is included and how it is presented in the output when you download, print, or email the data insight. For more information, see Using Data Insight Tables.
Using Data Insight Graphics
Every data insight has a graphic that shows a visual representation of the data. Typically, the graphic is based on aggregates of the values of a key data column. This helps you quickly identify trends, patterns, and outliers. Depending on the data insight type, this can be a line graph, a pie chart, or other kind of graphic that best captures the data in a meaningful and helpful way. All graphics are interactive allowing you to drill down into the data and, because the graphic and the data table are kept in sync, drilling down or panning up on the graph acts as a quick filter of the data on the table.
Quick Filtering with the Graph
The graphic on a data insight not only visualizes the data by aggregating and plotting the data by key values, it also works as a quick filtering tool to add a filter criteria on top of the filters that are already applied through the filter settings in the data insight definition or on the toolbar. When you quick filter, you instantly change the focus of the graphic, pulling forward the line or segment that you select.
When you change the focus of the graphic with a click or mouse action, you also filter the table accordingly. The data shown on the graphic and table are always kept in sync. By switching from one point to another on the graphic, you dynamically change the filtered data as you explore the results of the data insight. After quick filtering to see only the data rows with common key values, you can then sort and arrange the data columns on the table to surface patterns and outliers.
There are two ways that you can quick filter a data insight using features built into the graphic:
-
By clicking a line, point, segment, block or other representation of an aggregate of data values
-
By zooming in or out of a date and time range with a slider or a click
The specific quick filter features that are available on a data insight depend on the data insight type and the kind of graphical representations that are used in it.
Group By Controls the Aggregation
Some data insights have a Group By setting. When this is available, it allows you to choose between options of which key data value is aggregated to plot the data points on the graphic. Usually, you can change this dynamically while viewing a data insight, but for some data insight types you can do this only in its definition.
The chart visually represents all data rows that meet the current filter criteria. Each point or segment on the chart is an aggregate of a certain key value of the data.
The overall visual rendering gives you a sense of the relationships of the aggregate values, while tooltips that appear when you mouseover a particular data point or segment show you the details behind it.
Graphs in Print Outputs
When you create and download or email a print output of the data insight, such as a PDF, the graphic is included in the output, how you see it and based on the Group By option.
Outputted CSV files do not include graphics.
Using Data Insight Tables
In the bottom half of the data insight page when it is in the default view (graphic and table) is a table with the data that is included in the data insight. This data is based on two things:
-
The data insight type, which determines the kind of data that is collected with a specific purpose in mind.
-
The filters and column selections that are applied to the data insight. These, in turn, come from two sources:
-
The Filter and Columns settings in the data insight definition.
-
Any changes to the filters (from the toolbar tool), the column configurations, and the graphic's quick filter that you make dynamically while viewing the data insight.
-
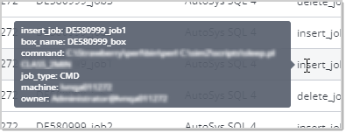
Tooltip with Details about Values
Mouseover any value in the Value column to display a tooltip with details about the value. A frame pops up with any available and relevant details about the value. Sometimes more details are relevant or available to present, and sometimes no more than you see in the Value column.
Copy Table Text to Your Clipboard
You can click into any cell on the table, highlight the text, and copy it (Ctrl+C) to our clipboard. You can then paste the text wherever you need it. This ensures that you accurately enter the data in search fields, queries, external programs, service ticketing systems, or any communications with colleagues or stakeholders, as needed.
Taking Actions on the Data Insight
When a data insight is open, you can take various actions on the data insight from the Actions menu available on each data insight. A user with viewer rights can take many actions on a data insight, but cannot change the data insight definition. Only the owner and editors can edit the data insight to change its definition.
The editors are those with Can edit rights granted to them in the Sharing settings of a data insight. The owner of a data insight and any defined editors can assign and change sharing rights. For more information, see Sharing Data Insights.
Use the following steps to take any of the actions that you are allowed to do on a data insight that you are viewing:
-
Click the Actions button
in the far right of the toolbar to open a menu with the available actions. -
Select the action you want to take. Depending on your role (owner, editor, viewer)
-
Edit (only owners and editors): Open the Edit Data Insight dialog to the Basic Information tab and edit any or all settings. For more information, see Editing a Data Insightin Adding, Editing, Copying, and Deleting Data Insights.
-
Schedule (only owners and editors): Open the Edit Data Insight dialog to the Schedule tab to change the scheduling settings. Before saving the data insight, you can edit settings on any other tabs as well.
-
Share (only owners and editors): Open the Edit Data Insight dialog to the Sharing tab to change who has access to the data insight and edit access rights. Before saving the data insight, you can edit settings on any other tabs as well. For more information, see Sharing Data Insights.
-
Save a Copy: Create a copy of the data insight with the currently set filters, column configurations, and Group By setting. The Sharing and Schedule settings from the original are cleared in the copy. For more information, see Copying a Data Insight in Adding, Editing, Copying, and Deleting Data Insights.
-
Save to Dashboard: Add a widget for the data insight to one of your existing or to a new dashboard tab. For more information, see Adding a Data Insight to Your Dashboard.
-
Delete (only owners): Remove the data insight from AAI. It disappears from all users screens, no more scheduled emails are sent.
-
Add to Favorites/ Remove from Favorites: Mark the data insight as a personal favorite, in which case it is added to the My Favorites tab views of the Data Insights list. Conversely, if it is already among your favorites, remove it from the list on your My Favorites tab.
-
Download (CSV): Create and download a CSV file with the data as it is filtered and configured in the data table at the moment when the file is created. For more information, see Actions for Downloading, Printing, and Emailing Data Insights.
-
Print (PDF): Create and download a PDF file that contains the graph and the data table with the data as it is filtered and configured at the moment when the file is created. For more information, see Actions for Downloading, Printing, and Emailing Data Insights.
-
Email (PDF): Send an email with a PDF attached to recipients that you specify and with the message that you enter. For more information, see Actions for Downloading, Printing, and Emailing Data Insights.
-
Get Link: Get the iframe HTML code to embed the data insight into an external website or a URL link to the data insight to add to documents or web pages. These allow you to point your users to the data insight from your other enterprise tools and their dadhboards. For more information, see Linking to or Embedding a Data Insight.
Note:Remember that, if the data insight is shared with other users, any edits you save will affect those users' experience with the data insight.
-