Monitoring
The Monitoring tab shows run data for completed, running and forecasted jobstreams. The difference between the Dashboard and the Monitoring tabs is that the Monitoring tab presents the data for individual jobstreams, whereas the Dashboard shows the same data in aggregated form (totals). The Monitoring tab presents data that spans 48 hours the previous and the next day. It contains multiple tools that let you configure the view to adapt the data to how you need it displayed. From the Monitoring tab you access the Gantt chart view (a powerful graphical representation of the jobstream runs) and the details of each job in a jobstream.
The Monitoring tab contains three panels:
-
Jobstream Monitoring Table
-
Alerts
-
Alert Properties
This topic explains the Monitoring tab and how to work with it:
Working with the Monitoring Table
The monitoring table is the top panel crossing the entire screen. Each row in the table represents a running jobstream. Initially, the Jobstream Monitoring Table on the Monitoring tab contains only one view called Monitoring1 with the default filter criteria. You can add as many new tabs as you need, each of them displaying different data.
Columns
Not all available columns are displayed by default. Right-click any of the column headers to display the list of all the columns. Select the check-boxes of the columns that you want to display. This list describes the columns and their values:
-
Actual End Time
Specifies the end time of the jobstream for completed runs.
-
As Of Time
Varies based on jobstream type. For Completed, the Actual End Time is shown. For In Progress, the time at which predictions were updated. For Forecasted, the Forecasted Start Time.
-
Average Duration
The average duration of the jobstream is based on historical runs.
-
Business Areas
The names of the Business Areas that this target job appears in.
-
Completed Jobs in Job- stream
Total number of jobs in the jobstream that have been completed in this run.
-
Currently Running Jobs
Names of all jobs that were running at the time the statistics were gathered.
-
Early(-) / Late(+)
The time early/late this jobstream is calculated to be based on the user defined early/late criteria. If no user-definded criteria is entered, it is based on a system determined average.
-
Forecasted Start Time
The time the jobstream is forecasted to begin.
-
Jobstream Average End Time
The average end time of the jobstream run based on historical runs.
-
Last Predicted Time
The time at which the last jobstream was predicted.
-
Late End Time
The time at which this jobstream run is considered late, based on user preferences or historical runs.
-
Late Fixed Duration
The user specified duration at which the jobstream is considered to be late.
-
Late System Calculated
The time or duration at which this jobstream run is considered late based on historical runs.
-
Late Time
The time at which this jobstream run is considered late, based on user preferences or historical runs.
-
Next Prediction Time
The time at which this next jobstream run will be next predicted.
-
# of Currently Running Jobs
Reflects the number of jobs that are currently running in the jobstream.
-
# of Jobs Predicted to Run
Based on the currently running statistics, the number of jobs that are predicted to run in the jobstream. This number can vary, as it takes into consideration any job failures that may have occurred or other dependency definitions that could influence the path of the jobstream.
-
Percent Complete
This statistic shows in a percentage format how much of the jobstream has completed as of the AS OF time.
-
Predicted End Time
The predicted end time of the jobstream run.
-
Run Elapsed Time
This statistic (in HH:MM:SS format) is the amount of time that the job- stream has been running since the start time.
-
Run Start Time
This statistic (in HH:MM:SS format) is the time that the jobstream started.
-
Scheduler Name
The name of the scheduler for the jobstream run instance.
-
Status
The percentage the jobstream is early/late based on the time early or late as a percentage of the expected overall duration.
-
System Calculated Status
The percentage the jobstream is early/late based on the time early or late as a percentage of the expected overall duration.
-
Target Job
Name of the Target job which is the last job in the jobstream.
-
Target Job Average End Time
The average end time of the Target job based on historical runs.
-
Total Jobs in Jobstream
The total number of jobs in the jobstream.
-
Type
Icon indicating whether the jobstream is Completed, In Progress, or Forcasted.
Toolbar
You can do the following on this view:
-
Click the top left button to open the Edit Jobstream Run Filter and modify the filter criteria of the selected jobstream. For information about how to filter the content of the table, see .
-
Next to the button, view a summary of the filter criteria used on the current view.
-
On the right hand side, view the total number of jobstreams that meet the filter criteria and how many of then are currently running, for example (7 of 16 in progress). Hover your cursor over this text to display a tooltip indicating how many are completed, in progress and forecasted.
-
Click the next button to open the Gantt chart view of the selected jobstream.
-
Click the button with the folder icon to open a dialog displaying the properties of the selected jobstream. In essence it is another view of the properties displayed in the panel. For more information, see Jobstream Properties.
Select the Show null properties checkbox to display all properties, including those with a null value.
-
Hover your cursor over the name of a jobstream to open a tooltip with information about the jobstream definition and target job.
You can add as many new tabs as you need, each of them displaying different data.
Your changes to the table layout are saved with your user settings. Each user has a unique set of saved preferences that are retained from session to session, even if you connect to AAI from different computers.
You access the real-time Gantt chart view of any running jobstream from this list. For more information, see Using the Gantt Chart View.
Adding Tabs
You can add as many new tabs as you need, each of them displaying different data.
-
Select the tab with the plus icon that is to the right of the last tab.
-
On the New Jobstream Run Filter dialog specify the filter criteria that determine what will be displayed on the new tab.
-
Click OK. The new tab is created.
The filter criteria are summarized at the top of the tab, next to the Edit Filter Criteria button. At the right hand side, AAI indicates the total number of jobstreams that meet the filter criteria and how many of then are currently running. The last two buttons at the open the Gantt chart view of the selected jobstream and the Jobstream Properties dialog respectively.
Moving Columns
Select the column header to drag and drop the column to its end position.
Resizing Columns
You have various options:
-
To resize the selected column, right-click it and select Auto-Size Column.
-
Click and drag the right edge of the column header
The Jobstream column is special. It is always visible on the left of the screen, even when the rest of the columns are scrolled left or right.
Copying and Pasting Cell Contents
Right-click the cell that you want to copy and select Copy cell. Then paste it (Ctrl-V) to the final destination.
Copying and Pasting the Entire Table
Right-click anywhere in the table and select Copy table. Then paste it (Ctrl-V)to the final destination.
Jobstream Options
Right-click on a jobstream name in the Jobstream Monitoring Table to open a menu with the following options:
Edit Jobstream
Select it to display the Edit Jobstream dialog.
Show Gantt View
Select it to display the real-time Gantt chart view. This is the same as clicking the button on the tab toolbar.
Delete Jobstream Run
Select it to permanently delete the jobstream run from the AAI database. A warning message box is displayed.
Capture Jobstream State
This feature is used for technical support purposes. If a jobstream run seems to behave unusually and it becomes necessary for the support team at Broadcom to investigate the specifics of a prediction, this option allows you to create an XML file which you can send to Broadcom for further investigation.
Root Cause Analysis
Select it to display the root cause analysis window.
Prediction Terminated Status
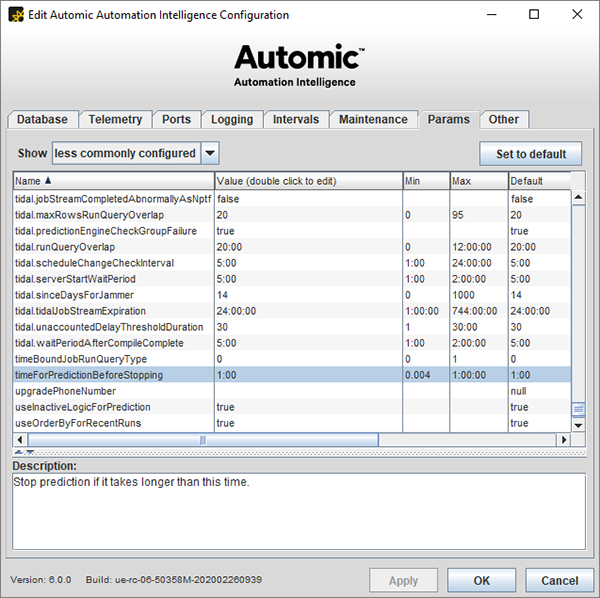
Automic Automation Intelligence allows users to configure a maximum amount of time it will allow them to make a prediction on any given jobstream. By default Automic Automation Intelligence is configured for one minute (1:00). This setting can be changed in the timeForPredictionBeforeStopping parameter in the Configuration tool.
If a prediction cannot be made in that time, a Prediction Terminated status will appear.
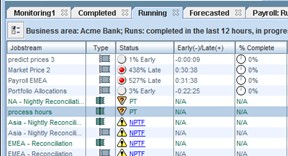
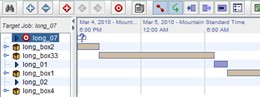
To look at a real-time Gantt chart of a jobstream with a Prediction Terminated status, hover over the jobstream, right-click, and select Show Gantt View. Note that some of the jobs in the Gantt view will be represented with a question mark icon. This icon is an indication that a prediction could not be made in the allotted time for the specified job. For more information, see Using the Gantt Chart View.
Alerts and Alert Properties Panels
For information about alerts, see Alerts.