Reporting with Vision Reports on Web v1
Although most reporting capabilities are available to you through AAI's data insights and integrated into various views and supporting functions for analyzing job and jobstream runs, AAI also offers reporting capabilities on its Web v1 interface. These reports are called Vision reports, named after the function that they run under.
This topic gives you an overview list of the types of Vision reports that are available to you, and it provides steps for how to create and maintain your Vision reports.
This page includes the following:
The Vision Report Types
The following Vision report (panel) types are available:
- Job Status Report
- Forecasted Job Runs Report
- Machines Report
- Job Dependencies Graph Report
- Jobstream Status Report
Prerequisites to Using Vision Reports
For the AAI Web UI reports to be available, the following must be true:
-
The AAI administrator has installed a specific and dedicated web server and application alongside AAI.
-
You have received the ID and password to log in to the AAI Web UI.
Accessing the Vision Reports
You can access the Web v1 where you can work with Vision reports in one of two ways, depending on where you start:
-
When you login to AAI:
-
Click the link Sign in to AAI - Web v1 on the bottom of the login pane.
-
Enter your Username and Password, and click LOGIN.
The main page where you can create and access Vision reports opens.
-
-
If you are already logged into AAI for any of the other functions:
-
Click your user icon in the far right the main title bar on any page,
-
Select Open AAI - Web v1.
A new tab opens and you are already logged into main page to create and access Vision reports.
-
This is the main page of the AAI Web v1 interface from which you can create and access Vision reports:
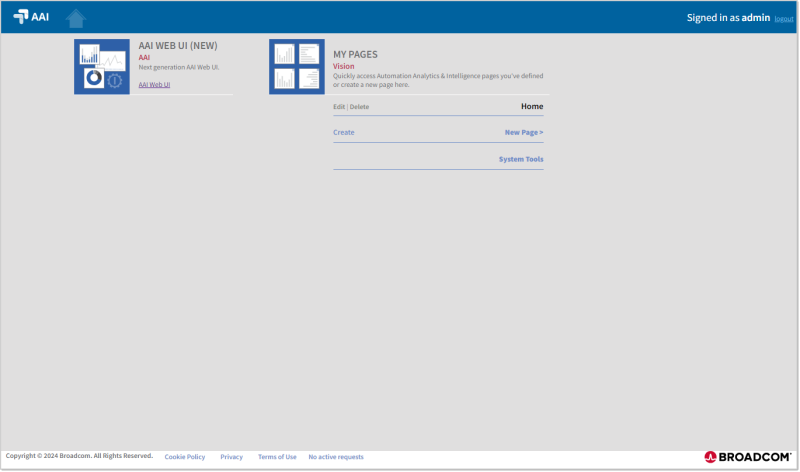
You find the Web UI reports in the MY PAGES section. It is also from this section that you start creating new pages (dashboards).
Closing the Web v1 with Vision Reports
The Web v1 and all the rest of AAI run under the same login. This means that if you have both open on different browser tabs or windows, and you log out of one of them, you automatically log out of the other. So, if you have a browser tab open with Web v1 and you are finished working there and want to return to any other AAI function, do not log out. Instead just close the browser tab or window. You will still be logged into the other AAI pages and they are open to wherever you left off, so you can continue from there.
Creating Report Pages
To create a Web UI report in AAI, you first create a dashboard, which is basically a web page. Then you add panels to that page. Each panel is a report that you can configure to provide the data that you need.
This is how you create a page and add panels to personalize your reporting environment.
-
On the Web UI landing page click New Page and enter a descriptive name on the New Page dialog.
-
Optionally, use Copy From User to duplicate another user's Vision dashboard, in effect, importing their panels just to use as is or to use as a starting point for configuring reports and panels for yourself. The skip to Step 6.
-
If you are adding a new page, in the SELECT PANEL TYPE you see the five Vision report types that are available. Click the Add + button for the report type you want to create.
-
Select the type of panel that you want to add.
-
On the Add <type> Panel dialog do the following:
-
Enter a descriptive name for the panel. It should describe the type of data on which it will report.
-
Later, when you have finished configuring the panel, select Published if you want to make this panel public. This will give access to other users to this report. They will be able to add it to their dashboards, copy, download and share it, and so forth.
-
Configure the data source for this panel. You can keep the defaults or click on the buttons to personalize the result by clicking the Contains anything/Any buttons and entering the filter criteria. For each data source you can add as many criteria as needed. These criteria are combined using the OR operator.
-
-
Click OK to add the panel to your dashboard.
The screenshot below shows a dashboard with four Vision panels (Trouble Job Streams, Job Dependency Graph, Active Job Streams, Completed Job Streams):
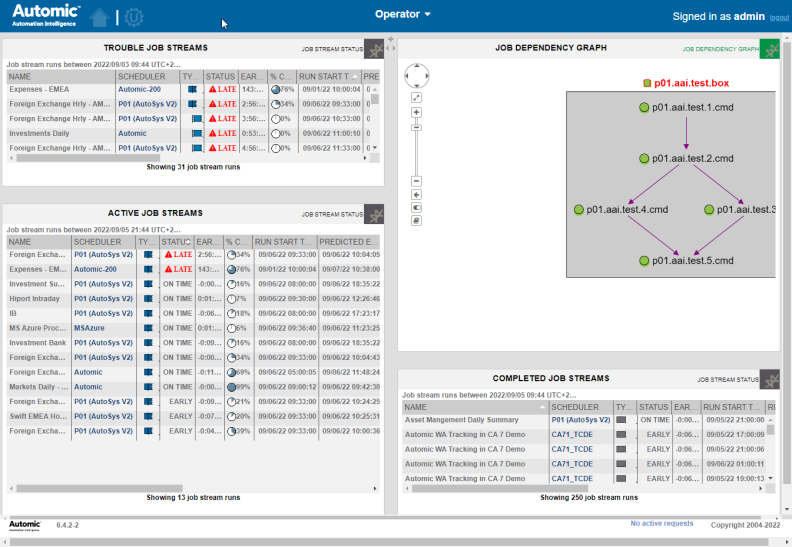
Use the plus symbol and the two little arrows on the upper right side of the panels to add a new one or to resize the current panel. To move a panel to a different position in the dashboard, you simply drag and drop it.
Each panel provides additional options that you can access by clicking its top right icon: Edit, Copy, Move, Delete, Shorter, Taller, Download, Get Link.
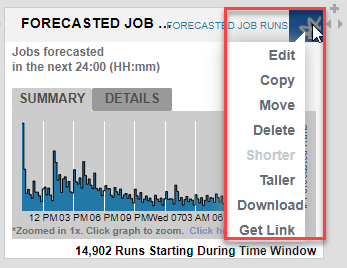
Most of these options are self-explanatory. With Get Link you create a link that you can share with other users so that they can access it.
See also: