Jobstreams Run Details - Relative to SLA
The Relative to SLA view of the Jobstream Run Details tab gives you an overview of the status of jobstream runs for one jobstream in relation to their SLA deadlines. For a member of the operations team, this graphical depiction of runs in relation to the SLA enables you to quickly assess the SLA compliance of a jobstream in recent runs as well as historically and how that has affected predicted runs. If you are analyzing of a jobstream's performance, you can view the SLA compliance for any filtered time range and discover patterns of compliance to guide you in your understanding. When you identify a run of interest, in one click you can drill down to the Gantt chart view to see the job execution sequence and dependencies of the entire jobstream process.
The Relative to SLA view is one of three views of jobstream run details, each of them show the same runs but presented differently to focus on another aspect of the run performance. You use them together to get more insight into the performance issues of a jobstream. The other two are the following:
- Jobstreams Run Details - Actual
- Jobstreams Run Details - SLA Graph, which also plots the run duration against the SLA deadline, but in a different way
You use these as part of your overall investigation of jobstream health and root cause research of runs that fail to meet their SLA deadlines. For more information, see Understanding the Jobstream Views.
This page includes the following:
Overview of the Relative to SLA
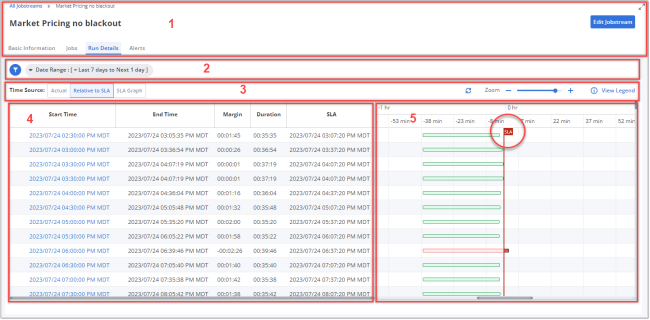
The Relative to SLA view is one of three views on the Run Details tab for a jobstream. When the view is open, the page is comprised of several areas, as highlighted in the following graphic:
-
The page header contains the following:
-
A simplified breadcrumb path in the upper left corner that includes only Jobstreams > [Jobstream Name].
Click Jobstreams to close this jobstream and open the Jobstream Definitions page, which contains a list of all jobstreams. There you can select another jobstream to work with. For information, see Viewing Jobstream Definitions.
-
The name of the jobstream in large type, which is also the title of the page
-
The Edit Jobstream button that opens the jobstream definition for editing. For information, see Adding and Editing Jobstreams.
-
Tabs to switch to the various jobstream details tab pages. For information, see Viewing Jobstream Definitions.
-
-
The filter toolbar allows you to filter the list in this view and shows you which filters have been applied to the list. You can filter the list of jobstream runs by date range and final run status (early, late, unknown, and so on). The default filter is only for the time range. It is set to show the runs of only the last 7 days to the next 1 day. For more information, see Using Filters (Web Interface).
Note:When you filter on status, the list that opens offers only the statuses that are relevant to the runs in the filtered time range.
-
The timeline toolbar contains various controls to change what you are viewing:
-
Click the Time Source buttons to switch among the three Run Details views: Actual, Relative to SLA, and SLA Graph. The view that you are on is highlighted.
-
Click the Refresh Timeline button to immediately bring up the latest data from the AAI database, rather than wait for the next automatic refresh (30 seconds by default). The last time at which data was fetched, whether automatically or because you clicked this button, appears to the left of the button.
-
Use the Zoom slider to zoom in and out of the timeline by decreasing and increasing the time intervals in Timeline pane. You see the date and times in the ruler at the top of the Timeline pane.
-
Click View Legend to open a pop-up with a key to the meaning of the various lines that can appear in the Timeline pane.
-
The main part of the view shows the jobstream runs in two parallel panes:
-
The left pane contains a list of jobstream runs. For a full description, see The Jobstream Runs List (The Left Pane) below.
-
The right pane contains a corresponding timeline that graphically depicts each run on the list. For a full description, see The Timeline Chart (The Right Pane) below.
The Jobstream Runs List (The Left Pane)
The Jobstream Runs list in the Relative to SLA view of the Run Details tab lists the completed, currently running, and predicted runs for the jobstream within the filtered date range and run statuses.
For each run, you see the following essential statistics in the data columns.
-
Start Time
When the jobstream run started. This is the start time of the first job in the jobstream. This is also a link that opens the Gantt chart view for the run. For more information, see The Gantt View for a Jobstream Run (Web Interface).
-
End Time
When the job run completed. This is the end time of the target job in the jobstream.
-
Margin
This shows how late or early the jobstream run is. Specifically, the Margin is the difference between the times in the SLA column (the SLA-required end time) and the End Time column (the actual end time). A negative value means that the run exceeds the SLA and is late. The greater the negative amount, the greater the SLA breach. Click the column header to sort the values in descending order and bring the runs with the greatest negative margin to the top.
As the Margin shows the lateness of a jobstream run, this value is the most important indicator on this view of problem runs.
-
Duration
How long the jobstream ran or is expected to run. This is the length of time between the start and end times for the jobstream run.
-
SLA
The exact date and time that the jobstream must end at or before if it is to satisfy the SLA criterion. Depending on how the SLA late criterion for the jobstream is defined, this can be the absolute end time specified in the SLA or it can be a calculated end time based on the SLA duration limit.
The Timeline Chart (The Right Pane)
The right pane in the main part of the Relative to SLA view of the jobstream Run Details tab contains a timeline chart. For each jobstream run that is listed in the left pane, the timeline in the right pane contains a single, corresponding, horizontal bar that spans the start to the end time of the jobstream run duration. The jobstream runs on the chart are placed relative to the SLA deadline. At a glance, you can see which runs have breached or are predicted to breach the SLA criterion, and by how much. You also can see which runs are ahead of the SLA deadline and by how much.
The SLA flag and how runs are organized around it
The distinguishing feature of the timeline pane on the Relative to SLA view is that it has a vertical line that runs its full length with an SLA flag at its head to mark the SLA deadline. This is not a specific date or time, it is a reference point for the SLA deadline, , regardless of whether it is a duration-based or time-based SLA. The jobstream runs are plotted on the graph to show their end time in relation to the SLA deadline.
The chart has two header rows: the top one for number of days and the one below for the number of hours or minutes. (You can use the Zoom slider in the view toolbar to increase or decrease the time intervals.) The zero point is the SLA flag. Negative time amounts are to the left and positive time amounts are to the right of the flag.
Early and in-time jobstream runs have the following characteristics:
- The duration bar is green.
- The end of the run is to the left of the SLA flag.
- The amount of time that a run ended earlier than the SLA deadline is a negative or zero value.
Late jobstream runs have the following characteristics:
- The duration bar is red for failed or gold for an unknown final run status.
- The end of the run is to the right of the SLA flag.
- The amount of time that a run exceeded the SLA deadline is a positive value.
It is worth noting the correlation of the Margin column values with the placement of the run duration bars on the timeline. Specifically, notice that the difference between the end time of a run and the SLA flag is the same amount as you see in the Margin column. Early and on-time runs have a positive Margin value, and a green bar for the jobstream run ends on the negative side of the SLA flag with the same value. Conversely, late runs have a negative Margin and their red or gold bar ends on positive side of the SLA flag.
This positive-negative divergence is because with a graphical representation against a zero-point SLA marker early runs cannot land on the positive side. Positive means the time over the SLA deadline.
Compare this timeline graph with the graph on the SLA Graph view, which also plots the jobstream run times against the SLA deadline. However, the SLA Graph uses a scatter diagram to plot the run end times against the SLA deadline (for end-time SLAs) or a candlestick diagram to plot run durations against duration SLAs. For information, see Jobstreams Run Details - SLA Graph.
Understanding the colors and markings in the timeline chart
The color and style of the run duration bar indicates the final status of the jobstream run. For example, green means on time and red means late. In addition, a solid border indicates completed, whereas a dotted-line border indicates the forecasted remainder or a future predicted run.
The color coding, border style, and other graphic elements used here is the same as on all timeline charts. For more information, see Understanding the Timeline Pane in Monitoring Current Jobstream Runs with the Timeline View (Web UI). When you are online and working in the view, click the Legend button in the timeline toolbar to open a window with examples of how the statuses and progress of runs are depicted on the timeline.
Each run bar is also a link that you can click to open the Gantt chart view for the run. For more information, see The Gantt View for a Jobstream Run (Web Interface).
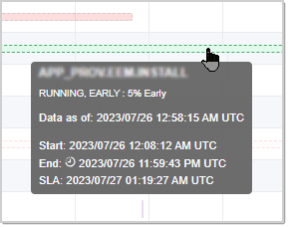
Tooltip with Details about a Jobstream Run
Mouse over any data point for a jobstream run or its SLA indicator to display a tooltip with details about the run. A frame pops up with the jobstream name, its run state, run status, start and end times, and the SLA deadline time.
See also: