Jobstreams Run Details - Actual
The Actual view of the Jobstream Run Details tab gives you a real-time overview of the status of jobstream runs for one jobstream in relation to the current time, which is clearly marked with a Now flag attached to a vertical line that runs down the entire length of the timeline.
For a member of the operations team, this condensed summary of what is happening around this moment in time enables you to quickly assess the current health of a jobstream. Once you identify a run that is in trouble, in one click you can drill down to the Gantt view to see the job execution sequence and dependencies of the entire jobstream process. If you're analyzing overall trends for performance improvement, you can look at the historical runs of the jobstream to see patterns of failed or late runs to guide your understanding.
The Actual view is one of three views of jobstream run details, each of them show the same runs but presented differently to focus on different aspects of the run performance. You use them together to get more insight into the performance issues of a jobstream. The other two are the following:
You use these as part of your overall investigation of jobstream health and root cause research of runs that fail to meet their SLA deadlines. For more information, see Understanding the Jobstream Views.
This page includes the following:
Overview of the Actual View
Consider the following graphic:
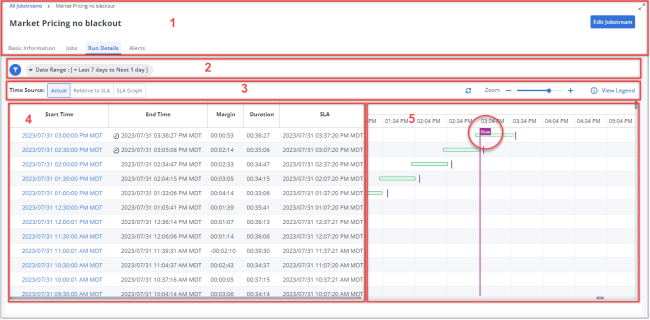
The Actual view is one of three views on the Run Details tab for a jobstream. When the view is open, the page is comprised of several areas:
-
The page header contains the following:
-
A simplified breadcrumb path in the upper left corner that includes only Jobstreams > [Jobstream Name].
Click Jobstreams to close this jobstream and open the Jobstream Definitions page, which contains a list of all jobstreams. There you can select another jobstream to work with. For information, see Viewing Jobstream Definitions.
-
The name of the jobstream in large type, which is also the title of the page
-
The Edit Jobstream button that opens the jobstream definition for editing. For information, see Adding and Editing Jobstreams.
-
Tabs to switch to the various jobstream details tab pages. For information, see in the Viewing Jobstream Definitions.
-
-
The filter toolbar allows you to filter the list in this view and shows you which filters have been applied to the list. You can filter the list of jobstream runs by date range and final run status (early, late, unknown, and so on). The default filter is only for the time range. It is set to show the runs of only the last 7 days to the next 1 day. For more information, see Using Filters.
Note:When you filter on status, the list that opens offers only the statuses that are relevant to the runs in the filtered time range.
-
The timeline toolbar contains various controls to change what you are viewing:
-
Click the Time Source buttons to switch among the three Run Details views: Actual, Relative to SLA, and SLA Graph. The view that you are on is highlighted.
-
In the right part of the toolbar, you see the last time at which run data was fetched, whether automatically at the configured refresh interval (30 seconds by default) or manually. This is followed by the Refetch Data button to its right. Click the button at any time to manually re-fetch the run data and immediately bring up the latest run data.
-
Use the Zoom slider to zoom in and out of the timeline by decreasing and increasing the time intervals in Timeline pane. You see the date and times in the ruler at the top of the Timeline pane.
-
Click View Legend to open a pop-up with a key to the meaning of the various lines that can appear in the Timeline pane.
-
The main part of the view shows the jobstream runs in two parallel panes:
-
The left pane contains a list of jobstream runs. For a full description, see The Jobstream Runs List (The Left Pane)
-
The right pane contains a corresponding timeline that graphically depicts each run on the list. For a full description, see The Timeline (The Right Pane)
The Jobstream Runs List (The Left Pane)
The Jobstream Runs list in the Actual view of the Run Details tab lists the completed, currently running, and predicted runs for the jobstream within the filtered date range and run statuses.
For each run, you see the following run statistics in the data columns.
To surface or compare values to help you understand how this jobstream is performing, you can modify the table in the following ways:
-
Open the Columns menu in the toolbar to show or hide any of the columns.
-
Click any one of the column headers to sort the table rows by the values in the column, click again to change the sort direction (ascending/descending).
-
Start Time
When the jobstream run started. This is the start time of the first job in the jobstream. This is also a link that opens the Gantt view for the run. For more information, see The Gantt View for a Jobstream Run.
-
Start Day
The day of the week when the jobstream run started. Sorting by this can reveal differences of jobstream performance on different days of the week.
-
End Time
When the job run completed. This is the end time of the target job in the jobstream.
-
End Day
The day of the week when the jobstream run ended. Generally, this is the same as the Start Day unless the run starts before midnight and ends after. Sorting by this can reveal differences of jobstream performance on different days of the week.
-
SLA Status
Whether the SLA is LATE, EARLY, or NPTF.
-
SLA Day
The day of the week when the jobstream run SLA occurs according to the way the SLA is defined for the jobstream.
-
Duration
The total runtime duration from the Start Time to the End Time.
-
Margin
This shows how late or early the jobstream run is. Specifically, the Margin is the difference between the times in the SLA column (the SLA-required end time) and the End Time column (the actual end time). A negative value means that the run exceeds the SLA and is late. The greater the negative amount, the greater the SLA breach. Click the column header to sort the values in descending order and bring the runs with the greatest negative margin to the top.
As the Margin shows the lateness of a jobstream run, this value is the most important indicator on this view of problem runs. -
Alerts
A badge that shows the number of alerts that were triggered during the jobstream run. The badge has the color of the highest severity alert among the triggered alerts. For more information, see Viewing the Jobstream Details - Alerts
-
SLA
The exact date and time that the jobstream must end at or before if it is to satisfy the SLA criterion. Depending on how the SLA late criterion for the jobstream is defined, this can be the absolute end time specified in the SLA or it can be a calculated end time based on the SLA duration limit.
The Timeline (The Right Pane)
The right pane in the main part of the Actual view of the jobstream Run Details tab contains a timeline chart. For each jobstream run that is listed in the left pane, the timeline in the right pane contains a single, corresponding, horizontal bar that spans the start to the end time of the jobstream run duration. A short vertical line in purple marks the deadline time of the of the SLA for that run. This is the time after which the SLA would be breached.
The Now flag
The timeline of the Actual view uses the same representations and has the same features as other timeline views. The distinguishing feature of its timeline is that it has a vertical line that runs its full length with a Now flag at its head to mark the current date and time. This gives you a quick reference point of what is happening now and around now, which can particularly helpful for operators during daily monitoring of jobstream activity.
Compare this to the timeline on the Relative to SLA view, where the run durations are plotted in relation to the SLA deadline. For information, see Jobstreams Run Details - Relative to SLA.
The header row of the timeline chart
At the top of the chart, you see the timeline columns for the dates and times. (You can use the Zoom slider in the view toolbar to increase or decrease the time intervals.)
Understanding the colors and markings in the timeline chart
The color and style of the run duration bar indicates the final status of the jobstream run. For example, green means on time and red means late. In addition, a solid border indicates completed, whereas a dotted-line border indicates the forecasted remainder or a future predicted run.
The color coding, border style, and other graphic elements used here is the same as on all timeline charts. For more information, see Understanding the Timeline Pane in Monitoring Current Jobstream Runs on the Timeline Page. Click the Legend button in the timeline toolbar to open a window with examples of how the statuses and progress of runs are depicted on the timeline.
Each run bar is also a link that you can click to open the Gantt view for the run. For more information, see The Gantt View for a Jobstream Run.
Tooltip with Details about a Jobstream Run
Mouse over any data point for a jobstream run or its SLA indicator to display a tooltip with details about the run. A frame pops up with the jobstream name, its run state, run status, start and end times, and the SLA deadline time.

See also: