The Gantt View for a Jobstream Run
The Gantt View for a jobstream run is the most important view for anyone who wants to fully understand one, specific jobstream run. On this view you can see all the jobs and the process flow of any currently running, predicted, or past jobstream run. You find rich, essential, up-to-the-moment details in an easily digestible form.
You see the entire process flow from job to job, and you can follow the critical path, explore dependencies, compare the current with their historical average run times, track progress against the SLA deadline, and more. In addition to the interactive Gantt chart visualization, you find job details on a table that you can sort, filter, and sync the Gantt chart with.
Whether you're monitoring jobstreams as part of daily operations or are investigating jobstream performance for immediate triage or longer-term optimization, the Gantt View provides you with essential information to get the job done.
This page includes the following:
Overview of the Gantt View
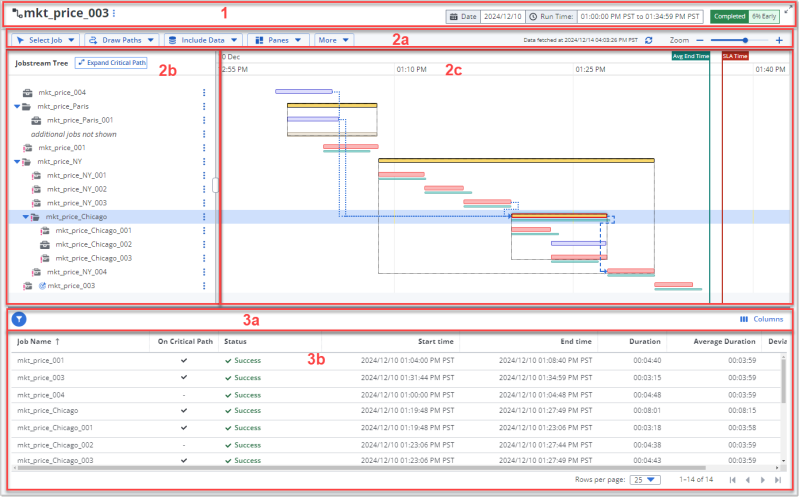
The Gantt View page, which shows the details of one jobstream run, is made up of the several areas:
-
The page header, which contains the following (from left to right):
-
The name of the jobstream in large type, which is also the title of the page.
-
The execution state (Completed, Running, or Forecasted) and status (EARLY, ON TIME, or LATE) of the jobstream run that you are viewing.
-
The start Date and Start time and End time for the run.
Depending on which state the run is in, these could be predicted or forecasted values. For example, a jobstream that is in the running state shows the actual start time and the predicted end time. A future run has a forecasted date and times.
-
-
-
The Gantt chart, which is made of the following three areas that are in the top part of the page below the page header:
-
The Gantt chart toolbar contains the options that you use to control what details that you want to include in the visualization of the jobstream run, as well as the options for sharing and saving the data on the view. For more information, see The Gantt Chart Toolbar.
-
The Jobstream Tree pane to the left of the timeline. The tree contains the jobs that are part of the jobstream run, based on its definition.
You can the collapse and expand parent jobs to hide and show child jobs in the process flow. Icons identify the job types, and the items on the list have interactive features that allow you to work with the jobs themselves. For more information, see Understanding the Jobstream Tree.
-
The Gantt Timeline pane to the right of the Jobstream Tree. The Gantt timeline is a visualization of the process flow of the job executions that make up the jobstream run.
What you see on the timeline is affected by the definition of the jobstream, the execution state of the jobstream (completed/running/forecasted), and the selected show/hide options and settings. For more information, see Understanding the Gantt Timeline.
Note:Depending on which of the various view settings are applied to Gantt chart, you see different panes, markings, and even jobs on the Gantt timeline chart. The views settings are controlled by the buttons on the toolbar, as well as from menus. For information, see The Gantt Chart Toolbar and Viewing Job Properties in the Gantt View.
-
-
The Jobstream Jobs table for the same jobstream run that the Gantt chart depicts. This table is comprised of two areas:
-
The table toolbar which contains the following controls (from left to right):
-
A filter tool with options that allow you to restrict the table to include only Jobs on the critical path or jobs with Longer than average run times. If you select both filter options, you get all the jobs that are on the critical path as well as any non-critical path jobs that are running longer than average.
-
A Show filtered view in Gantt toggle switch that you can switch on or off to align the Gantt chart with the jobs that the table includes. Note that the Gantt chart show/hide options, such as for unlinked runs or no runs, still apply.
-
A Columns menu that you can use to choose which columns are shown or hidden on the table.
-
-
The table itself that lists the jobs in the jobstream and provides their key job run statistics. For more information, see Understanding the Jobstream Jobs Table.
-
When you mouseover the border between the Gantt chart panes in the top and the table in the bottom, a double-arrowed splitter icon appears. Click and drag the icon up or down to change how much of the screen area shows the Gantt chart and how much the table.
Accessing the Gantt View
You can open the Gantt view for a jobstream run from any view that lists jobstream runs. These views have integrated links for the individual runs, which can be a linked field on a table, a property on a jobstream details page, or a data point on a graphic, as described here:
- The Jobstream Runs Timeline View by clicking the bar in the timeline chart (the right pane) that represents the run that you want to open in the Gantt View. For more information, see Monitoring Current Jobstream Runs on the Timeline Page (Web UI).
- The Jobstream Runs Grid View by clicking the Start Time for the run that you want to open in the Gantt View. For NPTF runs, you can also click the NPTF link in the SLA Status column. For more information, Monitoring Current Jobstream Runs on the Grid Page (Web UI).
- The Jobstream Definitions page by clicking the Start Time for a jobstream. For more information, Viewing Jobstream Definitions.
- Tabs on the Jobstream Definitions, Details page:
- The Basic Information tab by clicking either the times for the Most Recent Run or the Earliest Run. For more information, Viewing the Jobstream Details - Basic Information
- The Run Details views:
- The Actual View by clicking one of the following for the run that you want to open in the Gantt View:
- The Start Time in the left pane
- The bar in the Gantt Timeline (the right pane) that represents the run
For more information, see Jobstreams Run Details - Actual.
- The Relative to SLA View by clicking one of the following for the run that you want to open in the Gantt chart:
- The bar in the Gantt Timeline (the right pane) that represents the run
- The Start Time in the left pane
For more information, see Jobstreams Run Details - Relative to SLA.
- The SLA Graph View by clicking one of the following for the run that you want to open in the Gantt View:
- A data point for a run (the start/end time or duration amount) on the chart
- The Start Time in the table at the bottom of the view
- For NPTF runs, click the NPTF link in the SLA Status column in the table
For more information, Jobstreams Run Details - SLA Graph.
- The Actual View by clicking one of the following for the run that you want to open in the Gantt View:
- The Alerts tab, by clicking the Jobstream Run ID on the table. For more information, see Viewing the Jobstream Details - Alerts.
Navigating the Gantt View
The Gantt Chart Toolbar
The Gantt chart toolbar contains various toggle tools that you use to control which details that you want to see in the visualization of the jobstream run. The toolbar is where you have the options for sharing and saving the data on the view.
The Gantt chart toolbar contains the following:
-
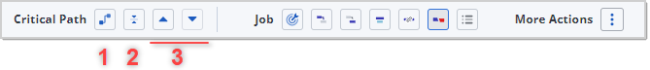
Critical Path tools: Use these to identify and track the course of the jobs on the critical path to the downstream target job:
Remember that the critical path jobs are marked with a red icon in the Jobstream Tree and are either shaded or bordered in red on the Gantt timeline. The toolbar buttons are essential tools to help identify and track the critical path, especially in large or complex jobstreams.
-
Show/Hide Critical Path Lines toggle: When this is on, red lines connect the jobs that are on the critical path. Each critical path line has a red arrowhead pointing to the critical path job that comes next in the execution sequence.
-
Expand/Collapse Jobs in Critical Path toggle: Use this to expand or collapse the nested child jobs that are on the critical path.
-
Go to Previous Critical Path Job and Go to Next Critical Path Job: When you are positioned on a job in the jobstream (that is, it is selected and highlighted), use these buttons to move to and highlight the previous or next job on the critical path. They are only active when you have Show Critical Path Lines on and when there is a previous or next critical path job to go to. At the beginning or end of the critical path there is no previous or next job, respectively.
These buttons are helpful to move quickly up and down the critical path, particularly for large jobstreams that have many jobs that might not be on the critical path. They can be essential when you want to understand jobstreams with complex execution flows.
-
-
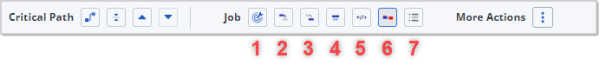
Job tools: Use these to surface the role of the jobs, their relationship to each other and other execution characteristics onto the Gantt chart.
-
Go to Target Job button: Use this to position the Jobstream Tree and the Gantt timeline to the target job, which is marked with a bull's-eye icon. The row for this job is highlighted.
This quick positioning tool is especially helpful if the target job is somewhere before the last job in the jobstream. With large jobstreams, one click can take you to the target job faster than scrolling.
-
Show/Hide Predecessors of Selected Job button: When this is on, whichever job you select will show a blue arrow pointing to the job that executes before it in the jobstream run. As you select different jobs, the predecessor line for the selected job appears. This is valuable information about dependencies that are likely to affect the successful start of the selected job.
-
Show/Hide Successors of Selected Job button: When this is on, whichever job you select will show a blue arrow pointing to the job that executes after it in the jobstream run. As you select different jobs, the successor line for the selected job appears. This is valuable information about dependencies that are likely to affect jobs down the line when the selected job fails or delays.
-
Show/Hide Average Durations toggle: Use this to see the average duration of each job on the Gantt timeline. The duration is depicted with a thin, purple line under the execution bar for each job. Each line starts and ends at the respective job's average start and end times. This makes it easy for you to compare the current execution of the job to its expected execution. .
By default, when Average Durations is on, you see an average duration line under every job on the Gantt timeline. However, you can define the options on the Average Durations tab of the Gantt Settings so that when you toggle the average durations on, you see average durations for only the jobs that run longer or shorter than average. This helps you quickly see which jobs might be affecting the overall success of the jobstream run. For more information, see Average Durations Tab.
-
Show/Hide unlinked jobs toggle: When this is on, you see an unlinked job icon, which is the same icon as on the button, at the end of each job that AAI considers to be unlinked. An unlinked job is one that is referenced in the AAI database and runs during the time frame of the jobstream run, but it is not incorporated in the jobstream definition.
Identifying unlinked jobs can uncover jobs that should be in the jobstream but are not for some reason. As such, unlinked jobs can point to a deficiency in the jobstream calculation.
-
Show/Hide No Runs toggle: When this is on, you see the no-run job icon (the same icon that is on the toolbar button) wherever AAI expects (from its jobstream definition calculations) a certain job to run and, for reasons that AAI cannot determine, the job run does not happen. You should investigate no-run jobs to find out why they did not run and whether you need to revise the job definitions or take other steps to resolve the problem.
-
Show/Hide Job Properties Pane toggle: When this is on, the Job Properties pane opens to the right of the Gantt timeline. You see the job properties for whichever job is currently selected. If the job runs more than once within this jobstream run, you see the properties for each run in columns next to each other.
-
-
A More Actions menu that provides you with additional actions for this view.
-
Select Export to download a CSV file with the contents of the Jobstream Jobs table (in the lower part of the screen) as it is currently configured in this view. For more information, see Exporting Table Data.
Exporting the Jobstream Jobs table gives you a snapshot at a specific time of the job execution details for the jobstream run. Use this to save or share pinpointed states of a jobstream execution. This can be helpful in jobstream performance assessments and triage efforts, especially when you need to share details of execution behavior with others to solve issues.
-
Select Copy URL to share the current view with stakeholders or members of your team who have access to your AAI instance and have rights to view the jobstream. When someone opens the URL, they can see the real-time activities and status of the jobstream. Unlike exporting the data, which preserves a snapshot of a moment in the execution when someone opens the URL, they can see the real-time activities and status of the jobstream.
-
Select Settings to define default view options for the jobstream run. For more information, see The Gantt Settings Menu.
-
-
Standard functions of all jobstream timeline views are also available:
-
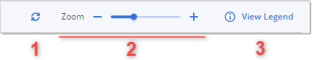
The last time at which run data was fetched, whether automatically at the configured refresh interval or manually. This is followed by the Refetch Data button to its right. Click the button at any time to manually refetch the run data and refresh the page immediately.(The default automatic refresh cycle is 30 seconds.)
-
Use the Zoom slider to zoom in and out of the Gantt timeline by decreasing and increasing the time intervals. Alternatively, you can click the plus (+) and minus (-) signs on either side of the slider to increase or decrease the zoom level. You see the date and times in the ruler at the top of the Gantt Timeline pane.
-
Click View Legend to open a pop-up with a key to the meaning of the various icons and lines that can appear on this view. This includes the icons next to the jobs in the Jobstream Tree as well as the lines and symbols that you might see on the Gantt timeline.
-
The Gantt Settings Menu
The Gantt Settings provide options to control what you can view on the Gantt timeline. The most useful options allow you to refine what happens when you toggle-on certain show options in the toolbar. Other settings offer an alternative way to select some view options that you also have on the toolbar.
The Gantt Settings dialog appears when you select the Settings option from the Action menu on the Gantt toolbar. The setting options are organized on the following tabs:
Average Durations Tab
On the Average Durations tab, you can refine which jobs will show an average duration on the Gantt timeline when you toggle-on the Show Average Duration button in the Gantt chart toolbar.
By default, when you toggle-on Show Average Durations, every job on the Gantt timeline will have a purple average duration line under its execution bar. In the Gantt Settings, you can use the options on the Average Durations tab to restrict which kinds of jobs will show an average duration when you toggle Show Average Durations on: only critical path jobs, or only jobs that are running longer or shorter than average. These options help you easily scan the Gantt timeline for the job runs that are significant to the overall success of the jobstream run.
The following are the options on the tab:
-
Show Average Duration checkbox has two purposes:
- Like the button on the toolbar, it toggles on the average duration lines on the Gantt timeline. As such it is an alternative way to show/hide the lines. Note that when you are using the Gantt chart, you can toggle the show/hide any time.
- More importantly, when it is checked, it unlocks the other settings on the page, which can change only when the checkbox is selected.
-
The Critical Path options in the Gantt settings allow you to choose whether non-critical path jobs will show an average duration line when the average duration lines are toggled on. Choose between the following:
- Jobs on the critical path only
- All jobs in the jobstream run (default)
-
The Longer /Shorter options allow you to choose which jobs will show an average duration line when the average duration lines are toggled on. Choose among the following:
- Jobs that are running longer than average
- Jobs that are running shorter than average
- Any jobs, regardless of its duration in the current run (default)
Runs Tab
The Runs tab of the Gantt Settings provide an alternative way to show or hide indicators of unlinked job runs or no-runs jobs, or both. You can also toggle these indicators on or off from the related buttons in the Jobs group on the Gantt chart toolbar.
Understanding the Jobstream Tree
The left pane of the Gantt View contains the Jobstream Tree. The tree contains the jobs that are part of the jobstream run. The jobs are listed in the order of execution, according to the jobstream definition, and shows the child jobs nested under parent jobs. You can expand or collapse parent jobs to show or hide the child jobs below it.
The Gantt timeline is coordinated with the Jobstream Tree
Each job on the tree has a respective execution bar on the timeline that you see on the same horizontal line as the job in the tree. When you expand or collapse jobs with child jobs, the timeline also expands and collapses the bars to be in sync with the tree.
You expand/collapse parent jobs from the tree
In general, you expand and collapse parent jobs from the Jobstream Tree. You do this by clicking the arrow next to the icon of the higher-level job (the parent job) to show and hide child jobs. To expand and collapse only critical path jobs, you use the related toolbar button.
Icons next to job names show type and function
Icons to the left of each job name identify the job type and indicate key functions or characteristics of certain jobs in the structure of the jobstream. In general, job types can be either a container job or a simple job. Key functions and characteristics of jobs include the following:
- The icon shape identifies the job type.
- The target job is marked with a bull's-eye icon next to the job type icon.
- Container jobs (parent jobs) are marked with a folder icon that is open or closed depending on whether the container is expanded to show the child jobs or not.
- Critical path jobs have red job-type icons. Non-critical path jobs typically have grey or black icons. Note:
You can filter the Jobstream Jobs table below the Gantt chart to show only critical path jobs. If you also toggle on the Show filtered view in Gantt switch at the table, then you see only the critical path jobs in the Jobstream Tree, as well as the Gantt timeline.
- Jobs at trim points or are descendents of trim points are flagged.
- Missing jobs, no-run jobs, and unlinked jobs are noted in parentheses after the job name on the Jobstream Tree and with an icon next to the job's execution bar on the Gantt timeline.
- A placeholder line appears in the job sequence in the Jobstream Tree to mark where there are "additional jobs not shown." The Gantt timeline marks this with a light beige execution bar.
This happens when the jobs in a jobstream are part of a larger workload process which includes other jobs that are irrelevant to the jobstream at hand. For example, the process branches in two directions based on a decision tree and only one of the options is relevant to the current jobstream and its SLA. (On the Gantt timeline this is represented by a light grey bar.)
Job names are interactive to provide more details
The job name on the Jobstream Tree is interactive to give you details about the job run and the job properties, as follows:
-
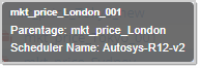
When you mouseover a job name, a tooltip appears with details about the job run. The frame that pops up shows the job name, the job's parentage path (when relevant), and the scheduler of this job run.
-
When you click a job name, its Job Details page appears. This page contains several tabs of information covering all the properties and execution statistics for the job. For more information, see Job Details.
Viewing Job Properties in the Gantt View
You can view the run details and the job properties of any job in a jobstream run directly in the Gantt view. This allows you to stay on the Gantt view and explore the details of one job after the other, in a smooth flow and all in context of the jobstream you are viewing.
Viewing Run Details and Job Properties
For any job on the jobstream tree, you can view the run details and job properties directly on the Gantt Timeline page in a pane in the right of the timeline.
To open the Job Properties pane
You can open this pane of job information in one of two ways:
-
From the toolbar by toggling the Open Job Properties Pane button among the Job tools. Use the same button to toggle the pane closed.
-
From the Action menu on any job in the Jobstream Tree by selecting the View Properties action.
If you were previously viewing the Gantt view for a particular jobstream and you had the Job Properties pane open, when you return to the Gantt view for that run or open the Gantt view for any run of the jobstream , the Gantt chart opens with the Job Properties pane open, and the target job is the selected job.
To close the Job Properties pane
To close the Job Properties pane you must use the toggle button among the Job tools of the Gantt timeline toolbar.
What you see in the Job Properties pane
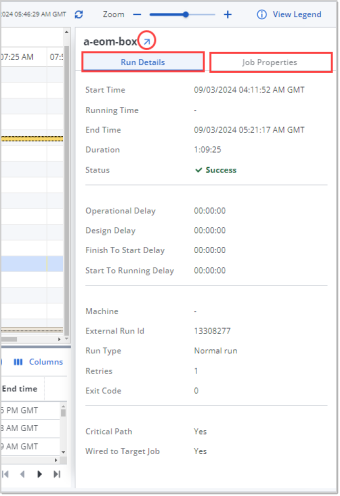
When the pane is open, it shows information about the selected job on two tabs:
-
Run Details:
job run details on GanttThis tab contains information about the selected job run as it ran in the current jobstream. The run information includes start, end, and running times for the run; the amount of delay for each delay type; and so on. This is the same information that you find on the Run Details pane for the same run as it is listed on the Run History tab on the Job Details page for the job.
However, unlike it, the Run Details tab from the Gantt timeline is different in that it includes has the following information that is relevant to the current run of the job in the current jobstream:
-
Retries: The number of retries for the run, rather than the historically based Deviation from Avg Retries that you see on the Run History tab
-
Critical Path: Whether the job is on the critical path of the current jobstream run
-
Wired to the Target Job: Whether the job is a predecessor to the target job.
For a description of each detail value, see Job Details - Run History.
-
-
Job Properties:
job properties on GanttThis tab contains all the job details that you find on the Basic Information tab of a Job Details page for the job. These details are listed under the same heading categories: Basic Information, Common Properties, CMD-Specific Properties.
For a description of each detail value, see Job Details - Basic Information.
When you select another job, the details in the Job Properties pane automatically changes for the selected job. This allows you to see the job details as you move up and down the jobs in the Jobstream Tree.
Run Details for Jobs with Multiple Runs in One Jobstream Run
Some jobs run more than once in the same jobstream run. When you view the Job Properties pane for any of the runs for such a job, the Run Details tab pane allows you to scroll through the statistics for each run with Got to Next and Go to Previous buttons in the header.
Click the Compare button to expand the pane and see a table of the statistics for each run next to each other. If they do not fit in the pane, you can horizontally scroll left and right to view the consecutive runs. Click Exit Compare to return to the collapsed view.

Opening the Job Details Page
There are two ways that you can open the Job Details page for any job directly from the Gantt timeline.
-
Using the Action menu of any job in the jobstream tree and selecting the Open Details option.
-
When the Job Properties pane is open, clicking the diagonally upward arrow next to the name of the job in the pane's title bar.
Both these actions open the Job Details page for the selected job in a new browser tab. The Job Details page has all job definition details as well as run averages, run history, and jobstream relationships, and parentage hierarchies.
Job Actions on the Jobstream Tree
You can take actions directly on any job in the Jobstream Tree. Click the three-dot, vertical ellipses (![]() ) to the right of any job name to open a menu with the actions that you can take on that job. The available actions fall into roughly the following groups:
) to the right of any job name to open a menu with the actions that you can take on that job. The available actions fall into roughly the following groups:
- Actions for Navigating and Understanding the Current Run
- Actions for Optimizing and Creating Jobstreams
- Custom Actions
Actions for Navigating and Understanding the Current Run
The actions in the top part of the job actions menu are useful for anyone investigating a jobstream whether as part of daily monitoring or jobstream analysis. They help you navigate the Gantt timeline in relation to a specific job.
The following list describes all the possible actions that can appear on the menu. When you open the menu from a job, only the actions that are relevant to that job are on the menu.
-
Open Job in New Tab:
Click this to open the Job Details page for the job in a new browser tab. For information, see Job Details.
-
View Properties:
Click this to open the Job Properties pane in the right of the Gantt timeline. You see the job properties for whichever job is currently selected. If the job runs more than once within this jobstream run, you see the properties for each run in columns next to each other. Selecting this has the same effect as clicking the toggle button among the Job tools in the toolbar for the timeline on.
-
Copy Job Name:
Use this to copy the name of the job to the clipboard of your device. You can then paste the name into another application or window, such as emails, chats, search fields, and so on. Copying ensures accuracy in your references.
-
Expand:
Use this to fully expand the container to show all subordinate jobs. This option is available when you select a container job for which the subordinate jobs are partially or fully collapsed.
-
Collapse:
Use this to collapse all jobs in the container into one line. This option is available when you select a container job for which the subordinate jobs are partially or fully expanded.
-
Expand Critical Path:
Click this to expose all subordinate critical path jobs in a container job. This is available only on container jobs that are on the critical path, which means that one or more of the jobs in the container are on the critical path.
You can then use the Critical Path tools in the toolbar to show the connecting lines and move between the previous and next jobs. These are particularly helpful for complex container jobs.
-
Collapse Critical Path:
Click this to expose all subordinate critical path jobs in a container job. This is available only on container jobs that are on the critical path, which means that one or more of the jobs in the container are on the critical path.
-
Go to Predecessor:
Click this to open a list of predecessor jobs for the selected job. Click a job name on the list to position the list and timeline to the job. Opening this sub-menu without selecting anything is a quick way to see a list of predecessor jobs for the job you selected. This option is available only when a job has predecessor jobs.
Opening this sub-menu without selecting anything is a quick and handy way to see a list of successor jobs for the job you selected.
-
Go to Successor:
Click this to open a list of successor jobs for the selected job. Click a job name on the list to position the list and timeline to the job. Opening this sub-menu without selecting anything is a quick way to see a list of successor jobs for the job you selected. This option is available only when a job has successor jobs.
Opening this sub-menu without selecting anything is a quick and handy way to see a list of successor jobs for the job you selected.
Actions for Optimizing and Creating Jobstreams
The following actions allow you to modify the jobstream definition directly from a Gantt view of one of its runs. Often, when you see the jobstream in the context of a real run, you can more easily recognize how best to refine its jobstream definition for more targeted monitoring and optimal SLA compliance.
-
Add Trim Point: When you select this, the Trimming tab of the jobstream definition opens and you are in edit mode.
The selected job is proposed as a trim point. Select whether to exclude only the predessor jobs or also the selected job. Make any further changes and then click Save. For more information, see Adding/Editing Jobstreams: Trimming.
-
Set Start Job: When you select this, the Start Jobs tab of the jobstream definition opens and you are in edit mode.
The selected job is listed on the table of start job candidates. Check the job name to set it as a start job for the jobstream you started in—optionally make any other changes to the jobstream definition in any of the other tabs—and then click Save. For more information, see Editing Jobstreams: Setting the Start Job. .
-
Remove Start Job: This appears only when the job is defined as a start job for the jobstream. Select this to remove the job from the start jobs list. Use this when you determine that the predecessor jobs to the start job are important to be considered in the jobstream predictions and statistics.
-
New Predicted Duration: Use this to define a fixed run duration to be used when forecasting or predicting run times for jobstreams that include this job. Note that this is a predicted duration for this job only, not the jobstream.
When you select this menu option, the Add Predicted Duration dialog appears with the relevant job properties included, such as the scheduler name, job name, and runtime averages. You can use the runtime averages as guidance when you define the predicted duration in the following fields:-
Predicted Duration: This is the duration to be used for forecasts and predictions instead of the calculated averages.
-
Description: This optional field gives a place to explain the reasons for the entered duration or other information that can be helpful to you or anyone who later tries to understand this job's run behavior.
-
Expiration Information: Select whether the new Prediction Never Expires or specify a date and time that the Prediction Expires On. Of course, the prediction can be changed again at a future date and these options can be redefined.
-
Anytime that a jobstream definition is changed in a way that affects how the run times or SLA compliance is calculated, the jobstream is rebuilt, its forecasts and predictions are re-calculated, and its historical statistics are reset. This can take quite a few minutes.
-
Create Jobstream: Select this to create a new jobstream where the selected job is the target job.
The Add Jobstream dialog opens on the Definitions tab. Read-only, key data about the jobstream (scheduler, parentage, and basic statistics) based on the target job is already provided. Add a name for the jobstream and then define the rest of the specifications on each tab of the Add Jobstream dialog. When you are done, click Save. For more information, see Adding and Editing Jobstreams. Remember to define the SLA specifications after AAI creates the jobstream.
Custom Actions
If custom actions are defined, they appear at the bottom of the list on the job actions menu. Custom actions can be anything that affects something in AAI itself, that is a change on the workload scheduler, or that is carried out on an external program or a third party system, for example, a "Submit Ticket" action that would open your company ticketing system and have job and run details already filled in the proper fields.
Such custom actions are created by an AAI administrator or jobstream administrator to provide additional tasks that you or other AAI users in your organization can conveniently invoke from the job actions menu. Depending on how an action was defined, you might need to be authorized to use them. Contact your AAI administrator if you need access to an action.
If you are an administrator and want to create a custom action, see Custom Actions.
Understanding the Gantt Timeline
The Gantt Timeline in the right pane of the page visualizes the process flow of the jobstream. Here you see which job leads to which other jobs and how long each job runs to make up the overall jobstream run from start to finish and whether it finished within the SLA deadline .
How to read the Gantt timeline
The Gantt timeline for a jobstream execution is rich with information that you can see at a glance. The following are the basics of how to read the timeline:
The timeline is in a horizontal bar graph. The vertical axis shows the jobstream jobs listed in their order of execution and nested in their parent-child hierarchies (the Jobstream Tree). The horizontal axis measures the execution date and time of the jobs over the whole jobstream run. Columns of the timeline mark the time intervals.
Use the horizontal and vertical scroll bars to move across and up and down the timeline.
Each job run is represented by an execution bar. Each execution bar starts and ends at the start time and end time of the respective job's run. Jobs that need more time to complete have longer execution bars. For
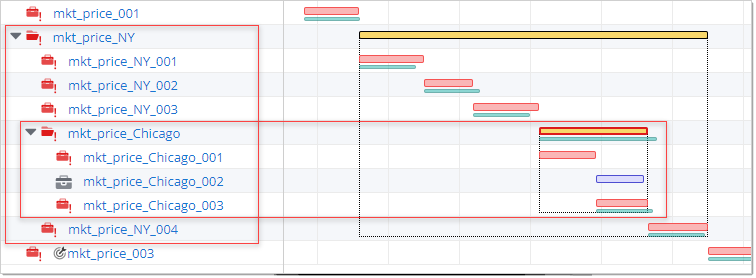
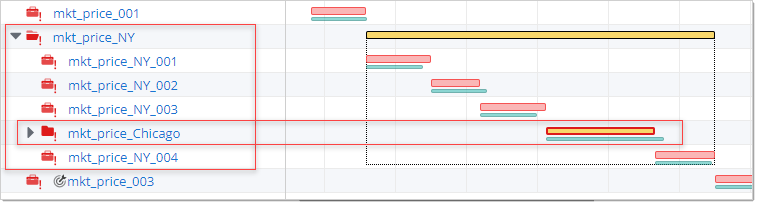
The execution bars are visually coded. The fill color and border style of a bar shows the primary characteristic of the job run with the jobstream run. For example.
- Container jobs are filled in yellow and critical path jobs are filled in red.
- A container job on the critical path is filled in yellow and outlined in red.
- A solid border show a job that has completed running, whereas a dotted border indicates a predicted run for a job that has not yet run. For jobs that are currently running, the portion that has completed has a solid line and the portion still to run has a dotted line, and it is bisected by the Now flag.
Vertical flags mark milestones and the current time. There are three vertical lines that mark significant milestones and times. They run the full length of the jobstream and have labeled flags, as follows:
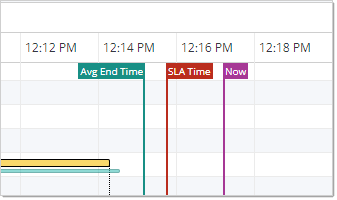
- Avg End Time flag in green marks the average end time for the jobstream based on all historical run data in the AAI database.
- SLA Time flag in red marks the SLA deadline time for the jobstream run. The target job must end before or on this flag to be in time to meet the SLA criterion. When the target job ends after this flag, the jobstream run is late and fails to meet the SLA.
- The Now flag in purple marks the current time. You see the Now flag only on timelines for jobstreams that are still running or are forecasted.
These milestone flags work together to help you understand how well the jobstream is performing and what to expect. For example, if you see that the jobstream has passed its SLA deadline but is within the average end time, then you know that a problem probably lies in the jobstream definition or resourcing, rather than in the individual run.
Container jobs are boxed together. When you expand a container job, its subordinate, child jobs appear indented below it on the Jobstream Tree. On the Gantt Timeline, the container job run, a yellow bar, expands and you see the child job runs below it. A dotted-lined box outlines the borders of the container job and its child jobs. The first job to run starts on the left border and the last job to run ends on the right border.
Example 1: Container job with an expanded sub-container job
Notice that each expanded container job on the Gantt timeline is outlined by a dotted-lined box. Also notice that the subordinate container job is also outlined with its own box.
Example 2: Container job with a collapsed sub-container job
Notice here that the subordinate parent job is collapsed, and therefore it has no box around it.
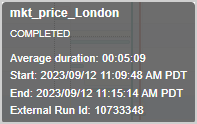
Tooltips with job details appear on mouseover. When you mouseover a job execution bar, a tooltip appears with some basic details about the job run. The frame that pops up shows the job name, its run status, the average duration, the start and end times of the run, and the External Run ID, which is the run ID on the workload scheduler.
Understanding the Jobstream Jobs Table
The table that you can see in the bottom of the Gantt View page lists all the jobs in the jobstream with some key statistics for the job run in this jobstream. To best utilize this table you should understand the following:
The Table Tools
The table toolbar which contains the following controls:
-
A filter menu with options that allow you to restrict the table to include only jobs with one of the following characteristics:
-
Root cause of NPTF
This option appears only for a jobstreams in NPTF status and shows the job with the issue that is preventing the jobstream from finishing, or expected to prevent the jobstream from finishing. For more information, see Root Cause Analysis.
-
Jobs on the critical path
-
Jobs with Longer than average run times
Select a combination of filter options, to see jobs that meet more than one option.
-
-
A Show filtered view in Gantt toggle switch that you can switch on or off to align the Gantt chart with the jobs that the table includes. Note that the Gantt chart show/hide options, such as for unlinked runs or no runs, still apply.
-
A Columns menu from which you can choose which data columns to show or hide.
Reconfiguring the table columns
Like other tables in AAI, you can configure the table of jobs runs to surface data to support your understanding of the jobstream run. This includes showing/hiding columns, sorting the table by the values in a certain column, and re-sizing and rearranging the columns. For more information, see Working with Tables.
Exporting the table data
To export the table to a CSV file exactly as you have filtered, sorted and arranged the data and columns, choose Export from the More Actions menu on the Gantt chart toolbar in the top part of this page view.
The Table Columns
The Jobstream Jobs Table can display the following data columns with run details for the jobs in the jobstream.
-
Start Time
When the job run started. This start time of the first job in the jobstream is also the start time of the entire jobstream.
-
End Time
When the job run completed. For the final job in the jobstream, the target job, this is the end time of the entire jobstream.
-
Status
For an in-progress job run, this is the current run status of the job. For a completed job run, this is the final status of the job run. The values are either "Success" or "Failure."
-
Duration
How long the job ran, or is expected to run, from start to finish.
-
Deviation from Average
The margin is the deviation of the duration of this job run from the absolute average of the durations of all runs of this job that AAI has stored in its historical database.
-
Start-to-Running Delay
The difference between the Start Time and the Running Time for the selected job. This indicates the time that the scheduler takes to prepare resources to run the job. High start-to-finish delays can point to scheduler inefficiencies or suboptimal load distribution.
The start-to-running delay of a job is included in the System Delay for the jobstream as a whole.
-
Finish-to-Start Delay
The time that passed after the job's last predecessor finished and before the current job started. High finish-to-start delays indicate scheduler inefficiencies because there is too much wait time that could be used in processing time. You might want to redistribute the workload on your agents.
The finish-to-start delay of a job is included in the System Delay for the jobstream as a whole.
Be aware that the time when a job is on-hold is included in finish-to-start delay, not operational delay.
-
System Delay
This is the sum of the start-to-running and the finish-to-start delays. When these delays are high, this is an indication that you should look at where you can optimize your scheduler workloads.
-
Built-In Delay
This is any delay that is hard-coded into the schedule, such as a hard-coded start time.
-
For jobstream runs in NPTF status, you see two additional, required columns that contain root cause information:
-
Reason
The reason that AAI determined is most likely to prevent a successful completion. For a list of possible reasons, see List of Root Causes.
-
Detail
This is the specific information about the object or flag or missing input that led to the NPTF status. For example, if the root cause is "Parent success/failure conditions not met, " the detail would show the job name and the status of the job runs.
For more information, see Root Cause Analysis.
-
For the full job details over all runs for that job, click the job name in the Jobstream Tree and open those pages. For information, see Job Details.