Monitoring Current Jobstream Runs on the Timeline Page
The Jobstream Runs - Timeline page provides an intuitive top level visualization of the current status of your jobstreams and jobstream runs. It shows you data per business area and filtered by a date range that goes from 7 days prior to 4 days after the current timestamp. The timeline page tells you about the performance of your jobstreams relative to their SLAs. It also provides aggregated data on the status (done, running and future) of both the individual jobstream runs and of all the jobstream runs within each business area. This view is a good starting point for you to investigate jobstreams that are not behaving as expected.
This page describes the Jobstream Runs - Timeline and its associated functions:
Overview

The Jobstream Runs - Timeline page is divided in four areas.
-
Upper area containing the following:
-
Breadcrumbs, a navigation aid that tells you where you are in the business area structure in the form of a text path. It shows the business areas that you have navigated to show what the timeline page currently displays.
-
Title of the page, which indicates the business area for which the jobstream runs are displayed. The pattern of the title is as follows:
Jobstream Runs: <business area name>
For example, Jobstream Runs - Finance displays all the jobstreams and their jobstream runs for a business area called Finance.
-
The Auto Refresh toggle.
When the Auto Refresh toggle is on, AAI automatically refreshes this page in the interval defined by your AAI administrator in the AAI Configuration Tool.
-
The + Add Jobstream button that you can use to create and define a new jobstream.
-
Below the view name and next to the filter symbol you see any filter settings that are applied to this page to restrict the run data that is displayed. For more information, see Filtering Run Data by Date Range and Filtering Run Data by Business Area.
NoteThe filter settings on the Jobstream Runs - Grid page and the Jobstream Runs - Timeline page are synchronized so that the jobstreams included on the two pages are consistent as you switch from one to the other. So, when you change the filters on one page and switch to the other page, the same filters apply there, too.
This also happens when you have used a saved view in the Grid page. If you change the filter settings on the Timeline page and switch back to the Grid page, the filters from Timeline view will have overridden the filters that were applied by your saved view. If you want to remove them, click Reset Filter or Reset View. Of course, with this, you change the filter settings on the Timeline view as well. For information, see .Saving Views on the Jobstream Runs Grid
-
-
Timeline toolbar containing the following:
-
The last time at which run data was fetched, whether automatically at the configured refresh interval or manually. This is followed by the Refetch Data button to its right. Click the button at any time to manually refetch the run data and refresh the page immediately.
-
Zoom slider
-
Click + to show shorter intervals in the timeline and zoom in to have a more detailed look at the jobstream runs. This is useful with runs that are short and that would display as very small boxes or even lines when zoomed out. The minimum interval is 5 minutes.
-
Click - to zoom out and show longer intervals. This provides you with a clear overview of the performance of the jobstream runs relative to their SLAs over a longer period of time. The maximum interval is one day.
-
-
View Legend button that opens a dialog that explains the meaning of the colors, lines and icons used on this page.
-
-
Left pane (Business Area and Aggregated Status Pane) with four columns displaying the following:
-
Business areas (represented as folders) and jobstreams
-
Aggregated states (Done, Running, Future) of the jobstreams and of the jobstreams within a particular business area.
For more information, see Understanding the Business Area and Aggregated Status Pane.
-
-
Right pane (Timeline) providing a visualization of the jobstream runs.
Navigate to the business area that you are interested in to display the jobstreams assigned to that business area and their jobstream runs. For more information, see Understanding the Timeline Pane.
Filtering Run Data by Date Range
The filter beneath the page title lets you restrict the runs that will be displayed by date range. Depending on your role in your company, you may want to restrict the page in different ways:
Operations/Monitoring
If you are working in an operations or monitoring team, you will probably want to set the date range filter to what is happening now because you are interested in the jobstreams whose SLA is in jeopardy. You may also be interested in the aftermath of problems that have recently occurred. Set the filter to what happened last night, earlier today or any other combination that captures recent events.
For these use cases, more remote history matters less than what has recently happened.
Analysis/Process Improvement
If your goal is to investigate trends and recognize patterns that indicate potential improvement possibilities, use large data samples. Set the filter to display longer periods of time. In addition to this page, AAI provides extensive functionality and multiple pages and views that help you analyze historical data
Filtering Run Data by Business Area
The names of the business areas in the breadcrumbs are links that let you quickly navigate back and forth in the business area path. The names of the business areas in the left pane are also links. Click a link to filter the timeline page by that particular business area.
Drilling Down with Quick Filters
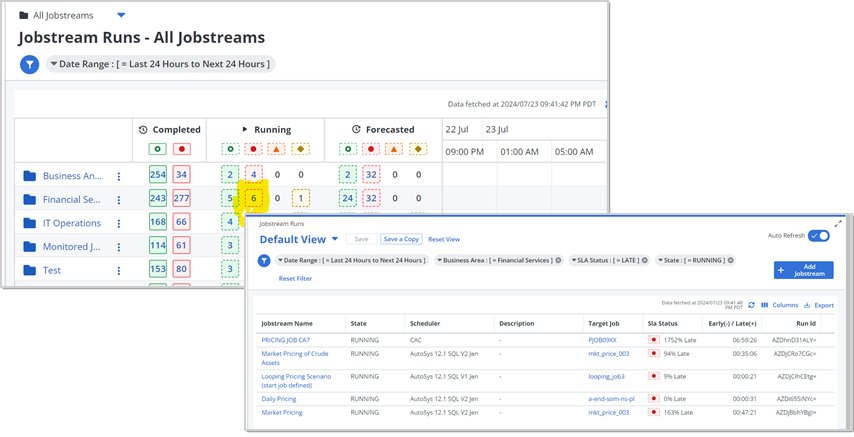
Every box under the status columns (Done, Running and Future) in the left pane acts as a quick filter that allows you, in one click, to drill down to the Jobstreams - Grid page with the jobstream runs behind the number in the box.
On the Jobstream Runs - Grid page that opens, you see that, in addition to any filters that were applied to the page you started from, more filters have been applied for the state and status of the column the box was in and for the business area or jobstream of the row that the box was in. With your browser's back button, you return to the Jobstream Runs - Timeline page that you started from.
In the following example, by clicking the box with 6 jobstreams in the Running state for the Financial Services business area, the Jobstream Runs - Grid page opens, showing the six jobstreams. In addition to the date range filter that was previously applied, the page is filtered for the Financial Services business area and from the column the box was in, the RUNNING execution state and the LATE SLA status.
Understanding the Business Area and Aggregated Status Pane
The left pane displays the list of jobstreams or business areas and their aggregated statuses. Each row is either a business area (recognizable by the folder icon) or a jobstream. Both are links that open either the content of the business area (child business areas or jobstreams) or the jobstream details page.
The Done, Running and Future columns provide the aggregated status of a jobstream / business area. In addition to the status codes and numbers (number of jobstream runs in a particular status), AAI uses colors and solid/dotted lines to help you visualize the overall status.
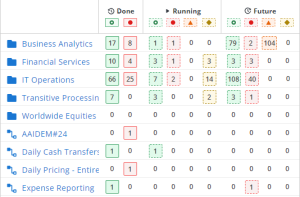
Aggregated Statuses
Business areas and jobstreams can have one of the following three overall statuses: Done, Running or Future. Each of these overall statuses has more specific statuses that are indicated by their color and the solid/dotted line. The numbers in the boxes in this pane indicate how many jobstream runs have complete with any of the available statuses per business area or jobstream.
To be able to provide jobstream forecasts, AAI predicts each of its jobs. Based on these individual calculations, AAI knows whether a jobstream will meet the SLA, whether it will finish or not, with what status, and so on.
Done
Jobstream runs that have already completed. A box with a solid border around the number indicates that they have finished.
-
Green
The jobstream run has completed on time (they have met the SLA).
-
Red
The jobstream run has completed late (they have not met the SLA).
Running
Jobstream runs that are still executing. A box with a dotted-line border around the number indicates that they have not finished yet.
-
Green
The jobstream run is Predicted on time, that is, AAI predicts that it will meet the SLA.
-
Red
The jobstream run is Predicted late, that is, AAI predicts that it will fail the SLA.
-
Orange
The jobstream run is NPTF (Not Predicted to Finish). Some job execution has failed along the way and the jobstream will not finish. When this happens, AAI lets the jobstream go through the root cause analysis engine and surfaces the resulting information (job that caused the NPTF status, reason for the failure and so on).
-
Yellow
The jobstream run is in an Unknown status. This is a jobstream run that is NPTF but the AAI root cause analysis cannot determine why the run will not finish. Unknown statuses are rare.
Future
Jobstream runs that have not started yet and that are forecasted. A box with a dotted-line border around the number indicates that they have not started yet.
-
Green means that the jobstream runs are predicted to finish on time and meet their SLAs.
-
Red means that the jobstream runs are predicted to complete late and miss their SLAs.
-
Orange means that AAI predicts that these jobstream runs will end as NPTF (Not Predicted to Finish). This can happen in future runs because the structure of the jobstream is such that something (some external dependency) must happen for the jobstream to run. AAI cannot be aware that there is an external event that will kick the execution of the first job. When that event happens and the jobstream run starts, its status changes to one of the Running states.
-
Yellow means that the jobstream runs are predicted to finish with an Unknown state.
Running statuses give you a very clear picture of what is currently going on in your system. From here, you can drill into the details of the jobstreams that are jeopardizing your SLAs.
Running or Future orange statuses with dotted line (NPTF) and red (no matter whether done, running or future) indicate that something is wrong in the jobstream and that further investigation is necessary. If orange, the issue that blocks the jobstream must be identified and solved.
Done would be interesting in a different context, for example when doing a post mortem analysis
Adding and Editing Jobstreams
The Jobstream Runs - Timeline page is one place that you can add a new jobstream.
To Add a Jobstream
Click the + Add new Jobstream button in the toolbar. For more information, see Adding and Editing Jobstreams.
To Edit a Jobstream
-
Do one of the following
-
The names of the jobstreams are links that open their details. Open the details of the jobstream that you want to edit and click the Edit Jobstream button in the toolbar.
The Edit Jobstream dialog is displayed, where you can modify the jobstream attributes.
-
Click the three-dot, vertical ellipsis
 next to the jobstream name to open the actions menu, and select one of the Edit options. The Edit Jobstream dialog opens to the corresponding tab. Although the options open the jobstream dialog to different tabs, once the dialog is open, you edit the values on any of the tabs.
 For more information, see:
-
Understanding the Timeline Pane
The right pane contains the timeline of jobstream runs.
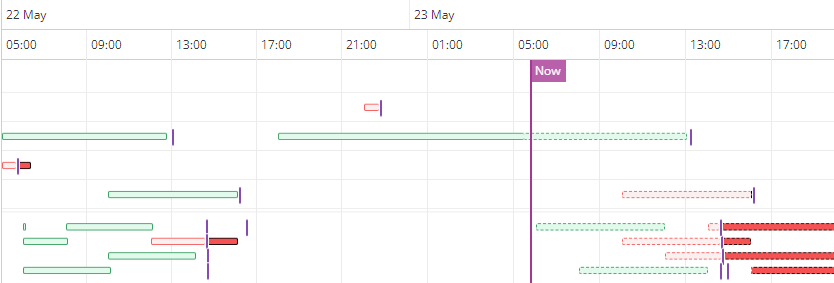
The timeline pane shows all the runs of the jobstreams that are on display within the time range that you have selected in the filter. A row in the timeline is either a business area or a jobstream. For business areas, the rows in the timeline are empty; the rows contain data for jobstreams only.
The columns in the timeline pane are time intervals. Use the Zoom slider in the toolbar to increase and decrease the intervals.
This pane shows the jobstream runs arranged in the timeline in the order in which they have been executed, are executing, or will execute. Each row has an execution bar that spans the start and end times of the jobstream run. he execution bars for the jobstream runs use the same color and solid/dotted-line coding as the left pane.
Each row has a short vertical line that is generally near each jobstream run. This indicates the jobstream's SLA. If a jobstream run ends before it, it means that the run finished before the SLA. If it ends afterward, the run has not met the SLA. When the SLA deadline has been exceeded or is forecasted to be exceeded, the SLA line splits the execution bar into the part of the execution that completed or is forecasted to complete before the SLA deadline and the part that continues to run after the SLA deadline. The size of the bar to the right of the SLA deadline indicates how late the jobstream is.
The current date and time is also clearly indicated by the purple Now flag and vertical line that runs the full length of the timeline.
You can open the Gantt view for a specific jobstream run by clicking the bar on the timeline for that run. For more information, see The Gantt View for a Jobstream Run.
Mouse over any data point for a jobstream run or its SLA indicator to display a tooltip with details about the run. A frame pops up with the jobstream name, its run state, run status, start and end times, and the SLA deadline time.
Drilling Down into the Jobstream and Jobstream Run Details
The name of the jobstreams in the left pane are links. Click a link to open the jobstream details page with four tabs that provide comprehensive information about the jobstream configuration and about its runs. This information helps you investigate the reason why a jobstream or a jobstream run is not behaving as expected.
For more information, see
See also: